The importance of delivering clear and impactful reports to clients in the ever-evolving world of SEO has never been more critical.
With the growing complexity of SEO strategies and tools, clients need transparency and actionable insights to understand how your efforts are driving results.
From quarterly SEO reports that highlight long-term trends to leveraging advanced tools like GA4 and Data Studio (formerly Looker Studio), Seth Kluver, AVP AI-SEO, will help you build reports that not only inform but also impress.
What We’ll Cover:
- What is SEO Reporting?
- Key Metrics to Include in Your Reports
- Best Quarterly SEO Reports For Clients: Why They Matter and How Ignite Visibility Excels
- SEO Reporting Tools
- Expert Tips for Building Effective SEO Reports
TL;DR
- Focus on business results: Track qualified leads, conversions, revenue, and ROI instead of vanity metrics.
- Choose relevant SEO metrics: Monitor organic traffic, keyword rankings, search visibility, and landing page performance.
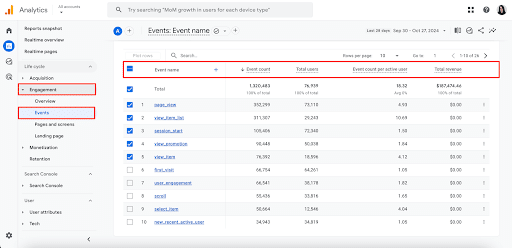
- Validate your tracking: Check GA4 events, conversion data, and Search Console before reporting results.
- Segment your data: Separate branded and non-branded searches, compare performance over time, and identify top-performing pages.
- Use the right tools: Combine GA4, Google Search Console, and Semrush to track performance and uncover opportunities.
- Make reports actionable: Explain what changed, why it matters, and what steps to take next.
- Report on AI visibility: Track AI search impressions, citations, and referral traffic alongside traditional SEO metrics.
What Is SEO Reporting?
SEO reporting should provide you with all the data you need to accurately assess your website’s performance. This includes metrics that align with both short-term and long-term goals.
Instead of including absolutely every piece of data you have, narrow it down to the key metrics that demonstrate the site’s performance. When you pair this with recommendations on how to further increase growth, your stakeholders will be happy with your efforts.
By 2026, it’s essential to integrate data from GA4, which allows for a more comprehensive view of the customer journey.
With machine learning models in GA4, you can now predict user behavior and conversion probability, offering deeper insights to optimize your SEO strategy.
There are multiple types of SEO reports that you can use, depending on your goals, including:
- SEO Audit Reports: This type of SEO reporting helps gauge where a website is currently at in terms of keyword rankings and overall SEO health. This can serve as a kind of baseline to determine what needs work and what’s currently working for a site.
- SEO Performance Reports: Meanwhile, an SEO performance report can help measure gradual progress of SEO efforts over time, including the performance of organic traffic and conversions.
- Keyword Ranking Reports: An SEO ranking report could detail positions for various target keywords, helping you figure out what keywords need additional optimization and where you fall compared to your competitors.
My Expert Opinion on SEO Reporting
I constantly see the struggle of translating complex SEO efforts into impactful reports. But here’s the key: effective SEO reporting shouldn’t be a battle with information overload.
Shift your focus to the SEO wins that resonate with your business goals. Are organic traffic numbers on an upward trajectory? Are your targeted keyword rankings driving more leads and conversions? Reporting mistakes happen, making it crucial to rectify them as much as you can with consistent observation and optimization.
With proper SEO reporting, you can get the results you want with effective measurement and informative insights. Ignite Visibility has implemented comprehensive SEO reports to guide multiple clients’ strategies, boosting one ecommerce client’s indexed pages by 130% with a technical SEO audit, with another client seeing 25% more traffic across 1,500 locations with scaled local SEO.
My Recommendation: Focus on visualizing your data! Using tools like Data Studio to create charts and graphs can turn complex metrics into easily digestible narratives. Don’t be afraid to add a sprinkle of client-specific context to personalize the SEO ranking report and demonstrate the value SEO is bringing to their business.
SEO Reporting for Different Audiences
When you create SEO reports, keep in mind that the types of reports you use will differ depending on the audience. Let’s look at some SEO report examples for marketers, business owners, and SEO professionals.
Marketers
An SEO report for marketers will focus on the performance of campaigns, user engagement, and content. There will likely be an emphasis on engagement metrics and how well content is performing based on topic authority, as well as details revealing how SEO efforts are contributing to overarching marketing strategies.
Business Owners
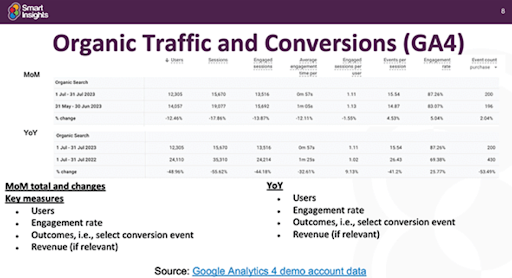
When drafting SEO reports for clients in various industries, you’ll likely be communicating efforts to business owners who don’t have very much experience or knowledge around SEO. As such, you should adapt your SEO reporting accordingly to include details that matter to them in a language they can understand. For instance, focus on the results of SEO efforts that show business growth, such as ROI, market share, and revenue, and use simple visuals with clear insights.
SEO Professionals
An SEO report for professionals in this industry will likely get into the nitty gritty when it comes to metrics and details. For example, a monthly SEO report could include in-depth details about technical SEO performance, along with competitor analysis and the performance of particular SEO components, like backlinks and Google’s Core Web Vitals.
Key Metrics SEO Reports Should Include
Since this SEO report will most likely be read by your boss or your clients, you want it to be the right balance between detailed and digestible.
Instead of including absolutely every piece of data you have, narrow it down to the key metrics that demonstrate the site’s performance. When you pair this with recommendations on how to further increase growth, your stakeholders will be happy with your efforts.
Keep reading for a list of things commonly seen on an SEO report. Remember that each of the metrics you track will depend on the key events you set, as the last thing you want is to focus primarily on vanity metrics that don’t really bring any value to SEO reports.
1. Dashboards
Your clients are busy. They want quick, easy access to important data that will show them the success of your efforts.
Dashboards give an overall, succinct view of how your SEO efforts are performing, with the ability to use the data to calculate return on investment (ROI). For example, you could use attributed revenue, a valid margin assumption, and SEO costs, putting together a formula that might look like:
Estimated ROI = (Attributed Gross Profit – SEO Costs) / SEO Costs X 100
Remember, those attribution assumptions are just that—assumptions—and attributable results might not reflect proven incremental impact. Additionally, in your lead generation efforts, separate estimated lead value from closed revenue.
Ideally, you’re going to want to offer dashboards that are not only easily accessible but also configurable. Design your dashboard to fit your client’s needs. If they want to see how many sessions or views their blog pages are receiving with the goal of boosting organic engagement, put that information closer to the top. If they are more interested in how many times the homepage was accessed to improve traffic to that particular page, put that close to the top instead.
The goal of your dashboard is to make your SEO reporting as easy as possible to follow and understand.
Dashboards should present various insights to draft the best SEO report, such as:
- Business Outcomes: Track metrics like qualified leads, organic revenue, pipeline value, conversion rate, and organic lead conversions.
Acquisition and Visibility: Measure organic sessions and users, search impressions, keyword rankings, and click-through rates, along with AI visibility.- These include:
- Organic Sessions: Measure the volume of visits coming from organic search results on Google, Bing, and other search engines.
- New Users: Determine how your SEO strategy connects people to your site who haven’t visited in the past.
- These include:
- Diagnostic Metrics: Indexation and crawl stats, Core Web Vitals and page speed, content efficiency, and backlink profiles.
If you want access to the best dashboards for your reporting, turn to Ignite Visibility’s reporting and analytics services.
2. GA4 Key Event Reporting
Any good SEO company will set up key event reporting and/or ecommerce tracking in GA4, using event-based tracking to capture valuable conversion data.
The type of goal, of course, depends on the type of website. Your client or boss is going to want to see how many goals of SEO traffic is driving.
Goals include things like:
- Key Events: Track actions that organic users complete, such as newsletter signups, form submissions, demo requests, and online purchases.
- Engagement Rate: Use this metric to see how many people stay on a webpage for longer than 10 seconds, view at least two pages, or complete a conversion event, such as form submissions, adding items to carts, and purchases.
- Landing Page Optimization: Look at landing page performance for blog posts, location pages, or other types of pages to see which get the highest volume of organic traffic and conversions.
You’ll want to start by identifying the important business action based on your objectives, mapping the customer journey in the process. You can then implement the specific conversion event that counts toward that action, be it a purchase, form fill, or another task (e.g., “order_completed” or “lead_form_submitted” in GA4).
You’ll then need to validate each event to confirm that data is being collected correctly. Start by triggering the action manually in a staging environment. Next, test it in production using GA4 DebugView or the Realtime report to confirm that the event fires and appears as expected for live users. Once you’ve verified the data collection, mark the event as a Key Event in GA4.
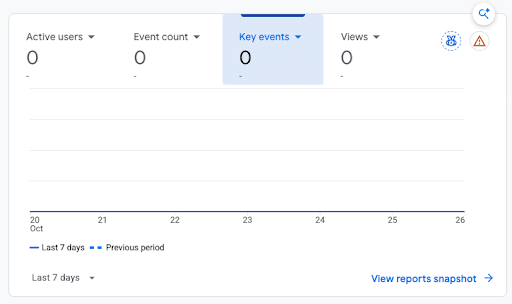
The idea is, you want your client to see a direct link between your SEO efforts and how they’re making a difference in helping the client reach their profit goals.
This is huge, as many companies don’t fully understand the “why” behind things like blogging or posting on social media. Key event reports filled with information on conversion rates, traffic numbers, and page visits help prove your value as a marketer. Keep in mind that it might be wise to run some benchmark reports before diving into goal performance.
3. Organic Traffic Conversions
Organic traffic attracts ideal customers searching for what you offer. Conversion data reveals who your top performers are – the pages generating the most buzz.
Focus on pages that are driving conversions from organic traffic. Use enhanced tracking in GA4 to measure product performance and user flow, ensuring that your SEO efforts are aligned with revenue goals.
Not to mention, it also can help you identify high-traffic content, expose potential content gaps, and analyze page views and landing page effectiveness.
4. Landing Page Report
Your SEO report should cover landing pages as well. It can help you identify top-performing pages to reveal which ones are driving the most traffic, conversions and engagement, helping you understand which pages resonate with your target audience and which ones need improvement.
A landing page is where a session starts, while page-view reports also count the pages people visit after that.
Using GA4, you can filter by organic traffic and optimize your measurement scope. Specifically, this platform’s session-based Organic Search grouping helps measure organic acquisition across search engines.
When comparing GA4 with Search Console, filter GA4 to session source / medium = google / organic, since GSC only reports Google Search.

5. Keyword Rankings
Track the positions of your top keywords in search engines. Are they climbing the ladder and attracting more organic traffic?
By monitoring your keyword rankings, you can identify which pieces of content are performing well and which ones are missing the mark. Don’t forget about related keywords that you should rank for as well. In fact, in some cases, the related keywords might be easier to rank (in terms of competitiveness) and/or better for your client (in terms of the number of monthly searches) than the keyword you were tasked with ranking.
You can find your organic keyword metrics in SEMRush, which provides visual data on overall keyword ranking, their volume, and any fluctuations. If you notice that your client’s top keywords are losing their positioning on Google SERPs, you’d want to point that out.
That’s why you should offer up a report that shows how many related keywords you’ve ranked for your client during your SEO stint. You’ll show them that you’re making an online impact or where opportunity still lies.

6. Website Technical Health
Think of your website as a car – it needs regular checkups to run smoothly.
Your website’s technical SEO health includes factors like:
- Site Speed – How quickly your pages load
- Broken Links – Dead ends
- 404 errors – Pages that don’t exist anymore
- Indexability – Whether search engines can index your pages and include them in search results.
- Canonicalization – Whether search engines receive clear signals about which version of a page should be treated as the primary one.
- Robots Directives – How crawling and indexing instructions affect search engine access. For example, robots.txt controls crawling, while noindex directives control whether a page can be indexed.
- Redirects – Whether outdated or moved URLs correctly direct visitors and search engines to relevant replacement pages.
- Sitemaps – Whether your XML and HTML sitemaps help search engines discover pages and visitors navigate your website. Learn more about XML vs. HTML sitemaps
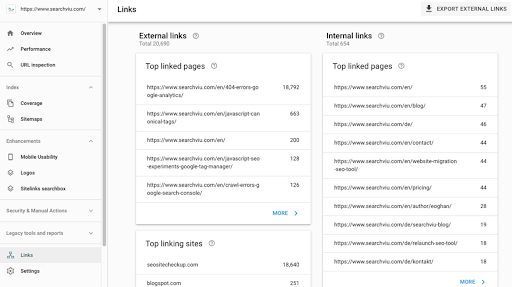
- Internal Linking – How effectively pages link to one another to help visitors navigate your website and search engines discover important content.
- Affected Page Templates – Which page templates are impacted by technical issues, such as product pages, blog posts, or location pages. Identifying these patterns helps you prioritize fixes that can improve multiple pages at once.
Meanwhile, metrics to track for Google’s Core Web Vitals include:
- Largest Contentful Paint (LCP): The speed with which a page’s main content appears on a user’s screen.
- Interaction to Next Paint (INP): How quickly a page responds to user interactions, including clicks and taps.
- Cumulative Layout Shift (CLS): How much elements on a page shift unexpectedly.
When reporting on Core Web Vitals, distinguish between field and lab data. Field data from real users, available through the Chrome User Experience Report (CrUX) and Google Search Console’s Core Web Vitals report, reflects the experience Google uses for its page experience assessment. Lab tools like Lighthouse help diagnose performance issues under controlled conditions.
Track improvements by page group or template, such as product pages, blog posts, or landing pages, rather than relying on one overall site speed score. This makes it easier to identify recurring issues, prioritize fixes, and measure improvements across your website
7. Backlinks
Backlinks are still important for SEO, helping build more authority for search engines.
Evaluate relevant referring domains to maintain high-quality backlinks, consider earned coverage from industry-relevant publications, and reclaim important lost links to keep them working for building authority. Also, consider referral outcomes and assess experience, expertise, and trust via broader evidence.
8. Opportunities for Growth
Review search trends using Google Trends or by diving into your analytics. Google Trends represents normalized relative interest, often on a scale of 0 to 100, not precise search counts. Note how frequently users search for your business name and the services you offer.
Look beyond searches, too – see how many people actually click through to your website or give you a call. This insider information will shed light on your local online presence and help you craft winning strategies to boost your growth.
Branded vs. Non-Branded Search Results
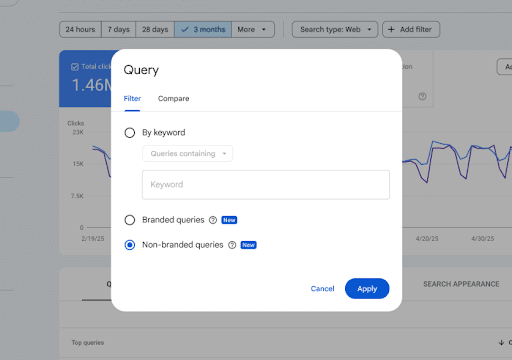
I also suggest separating branded demand from nonbranded discovery, looking at the ways people either begin or continue their journey with your brand.
Google Search Console’s branded query filter rolled out to all eligible sites in March 2026. However, it’s only available for top-level properties, not subdomain or URL-path properties. Data availability may also be limited for sites with insufficient query or impression volume.
Keep in mind that Google’s branded and nonbranded classifications aren’t always accurate. Review the query groupings to catch misclassified searches before drawing conclusions about performance.
If the filter isn’t available to you, you can also review query patterns manually to measure branded versus nonbranded search performance.
Look at Business Outcomes and Lead Quality
The best SEO report will go beyond tracking form submissions and site traffic. When CRM data supports it, track more meaningful metrics like:
- Qualified leads
- Booked appointments
- Sales opportunities
- Closed customers
- Revenue
At the same time, keep contact button clicks, completed inquiries, and qualified opportunities separate in your complete SEO report to get a better feel for lead quality.
As leads move down, evaluate their relevance and overall quality to gauge how well your strategy is actually performing.
Monthly vs. Quarterly SEO Reporting
While monthly reports provide frequent updates, quarterly SEO reports are invaluable for capturing broader trends, seasonal shifts, and long-term performance metrics.
Why Quarterly SEO Reports for Clients?
Comprehensive Insights: Unlike monthly reports that focus on short-term changes, quarterly reports highlight long-term SEO trends and performance, giving clients a broader view of how their SEO efforts are paying off over time.
Seasonal Adjustments: SEO strategies often need to adapt based on seasonality. Good quarterly reports will provide a perfect opportunity to analyze how changes in consumer behavior, product launches, or marketing campaigns impact organic traffic and conversions.
Strategic Adjustments: With three months of data, you can better evaluate what’s working, what’s not, and make more informed strategic adjustments moving forward. The right action register will entail looking at findings and evidence, followed by specifying a proposed action, establishing a priority, assigning an owner, setting a deadline, and determining a success measure.
The cadence for these quarterly SEO reports works as follows:
- Operational monitoring to look for any changes that need investigating
- Monthly performance reporting to further identify and determine how to fix any issues
- Quarterly strategy review adjusted to unique business needs
Year-over-year comparisons are just as important as observing prior-period changes, looking at seasonality, tracking changes, looking at unequal reporting periods, and preparing for site migrations, promotions, and location openings before attributing movement to SEO.
And the next report will help you check whether previous recommendations were both implemented and effective.
What Sets Ignite Visibility’s Quarterly Reports Apart?
Custom Dashboards: Tailored to client goals, Ignite Visibility creates easily digestible quarterly reports using Data Studio. These reports not only highlight traffic and ranking performance but also include in-depth insights into conversions, content performance, and competitive analysis.
Actionable Recommendations: Alongside performance metrics, quarterly reports include clear, actionable recommendations. Whether it’s targeting new keywords or optimizing existing content, Ignite Visibility ensures clients leave each quarter with a roadmap for continued growth.
Pro Tip: Quarterly reports help showcase what improved, what declined, what evidence backs the change, and what will happen next.
What Are Some of the Best SEO Reporting Tools for 2026?
If you want to produce high-quality reports, you’ll need to enlist the aid of one or more tools. There are a variety of SEO tools out there and each of them has different strengths. Here is a list of some of our favorites:
Google Search Console
Think of this as a free website checkup from Google itself! It reveals how Google perceives your website, how other sites link to you, and how your content performs in search results. Search Console also offers valuable reports on indexing, search performance, URL inspection, Core Web Vitals, and more.
Specifically, this tool measures clicks, impressions, CTR, and average positions directly in Google Search results.
Use it to segment data by relevant pages, queries, countries, and devices.
Keep in mind that the average position is an aggregated measure, not a permanent ranking.
If you notice any changes in GSC, you can investigate them to see why the change occurred and determine the next step. For example, a drop in CTR might line up with changes in which queries you show for, your average position, or how the results page looks.
Note: If you have a visually driven or ecommerce business, GSC now has web multimodal search reporting as of September 24, 2026. It applies to searches coming from features like Google Lens and Circle to Search, but it works differently from reporting the Images search tab. It works best when you have enough meaningful data to supply it.

Google Analytics 4
GA4 has become a must-use tool, offering enhanced tracking and reporting that allows you to connect observed interactions across configured websites and apps, albeit with some limitations around implementation, identity, and consent.
- Key Features: GA4 provides advanced user tracking and event-based reporting, making it essential for tracking user behavior and conversions across multiple platforms. In some cases, predictive metrics are also available as an optional advanced feature, with predictions potentially covering purchase probability, churn probability, and revenue, with certain requirements in place for minimum data thresholds and model quality.
- Use Case: It’s perfect for understanding the full customer journey, from first touchpoint to conversion.
Just remember that cross-device reporting depends on identifiers available, as well as SEO reporting settings. Using this platform alone doesn’t automatically allow for complete customer-level visibility.
Enhanced measurement can work for various business types, including ecommerce brands. However, you’ll need to set up the appropriate ecommerce events and parameters to track metrics like product views, cart actions, purchases, refunds, and associated revenue.
In GA4, you can follow this validation checklist to ensure everything is working the way it should:
- Event firing
- Transaction identifiers
- Order value
- Currency
- Duplicate purchases
Data Studio:
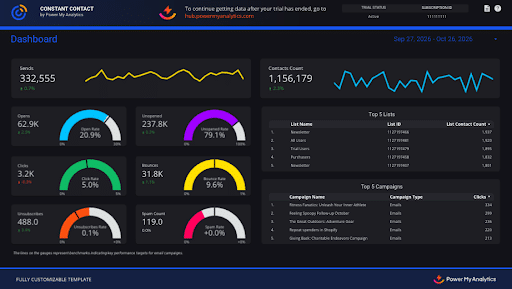
Formerly known as Looker Studio, Data Studio enables collaboration and customization for tailored reporting, with refreshes according to source availability, connector behavior, and configured freshness.
- Key Features: Data Studio allows you to create fully customizable SEO reports using data from various platforms like GA4, Google Search Console, and SEMRush.
- Use Case: For creating client-facing reports that are visually engaging, Data Studio is unbeatable. You can tailor dashboards to highlight the most critical SEO KPIs. However, third-party connectors and source subscriptions could introduce more costs or restrictions; for instance, Semrush connector access will depend on the relevant subscription.
SEMRush
A classic for keyword tracking and competitor insights. Pair it with Ahrefs for a more rounded SEO approach, focusing on backlink strategies and competitive analysis.
- Key Features: SEMRush is one of the top tools for keyword research, backlink tracking, and competitive analysis. It also provides detailed reports on Authority Score, traffic, and keyword ranking changes with its own set of unique metrics.
- Use Case: Use SEMRush to track keyword fluctuations, identify competitor strategies, and pinpoint content gaps.

Ahrefs
- Key Features: Ahrefs specializes in backlink analysis, keyword tracking, and site auditing. It’s particularly useful for monitoring competitor strategies and identifying potential content opportunities.
- Use Case: Use Ahrefs to enhance your backlink profile by identifying high-quality sites that could link back to your content.

Sitebulb
For technical audits, Sitebulb offers advanced insights that can help measure technical data, which, together with performance data, can work to optimize business outcomes.
- Key Features: Similar to Screaming Frog, but with a more visual presentation, Sitebulb provides detailed insights into technical SEO. It also offers guidance on how to fix issues, making it particularly useful for SEO teams.
- Use Case: Perfect for technical SEO audits with visual impact, helping clients understand the state of their website.

Oncrawl
Use Oncrawl as another technical tool to contribute to the best SEO reports.
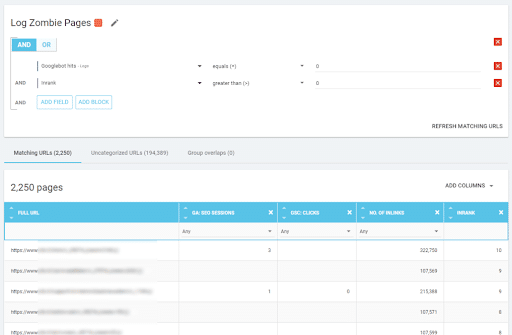
- Key Features: Oncrawl can help with site crawling and log analysis, with integrations that can help you implement it within your existing workflows.
- Use Case: This tool is great for technical and crawl audits, helping find broken links, server errors, and unnecessary redirects.
Screaming Frog
This website crawler acts like a digital inspector, scanning your website for technical SEO issues like broken links and slow response times. The free version is perfect for smaller websites, allowing you to scan up to 500 URLs per crawl, while paid plans offer more extensive features.
- Key Features: This technical SEO crawler tool scans your website for issues like broken links, duplicate content, and slow response times. It’s perfect for technical audits that impact search rankings, though it’s important to keep in mind that crawl response times differ from complete UX measurements.
- Use Case: Screaming Frog is your go-to tool for ensuring that your website is optimized from a technical standpoint, with the help of complementary performance measurement tools.

Moz Pro
Moz offers a robust SEO toolbox with features for keyword research, search volume data, on-page SEO analysis, link building insights, and competitor comparisons. Moz Pro is a well-rounded platform ideal for agencies and businesses that need in-depth SEO data and reporting.

BrightLocal (For Local SEO Reporting):
- Key Features: BrightLocal is a must for local SEO efforts, providing in-depth reports on Google Business Profile, local keyword rankings, and customer reviews.
- Use Case: Essential for businesses that rely on local traffic and reviews, BrightLocal offers specialized tools to track local SEO progress.

Let’s break down the main attributes and selection criteria for each tool:
| Tool | Data Supplied | Ideal User | Material Limitations | When to Use |
| Google Search Console | First-party search performance metrics from Google Search | SEO specialists and webmasters | Filters out low-volume queries for privacy, and doesn’t supply non-Google search engine data | Troubleshooting crawl errors, checking index status, and analyzing organic queries getting clicks on Google |
| Google Analytics 4 (GA4) | User behavior metrics, including sessions, engagement rates, and key events | Digital marketers and analysts | Data sampling on large queries comes with strict retention limits, and cookie consent banner dependencies could compromise totals | Tracking post-click user journeys and attributing revenue to organic traffic, along with monitoring landing page conversions |
| Data Studio | Aggregated data visualizations from connectors like GSC, GA4, and Google Ads | Marketing managers and agencies | API quota limits can cause loading errors, with no native storage | Building automated marketing dashboards and consolidating several data silos |
| Semrush | Keyword rankings, competitor traffic, historical search volumes, backlink profiles, and PPC campaign data | In-house marketers and SEO teams | Search volume metrics function as estimates, not precise values, and database refresh rates vary for niche regions | Conducting deep keyword research, looking at competitor ad budgets, and monitoring search visibility |
| Ahrefs | Live backlink index mapping, keyword discovery, domain authority metrics, and organic content performance tracking | Link builders and SEO strategists | Can underrepresent low-volume long-tail terms | Conducting backlink audits, looking at content gaps, and monitoring link acquisition |
| Sitebulb | Visual architectural site audits, crawl path diagrams, and structured data validation | Technical SEO auditors | Desktop app structure makes it dependent on hardware performance, and it can be slow to process for larger websites | Doing a deep dive into site architecture, conducting structural pre-migration tech audits, and visualizing internal link issues |
| Oncrawl | Enterprise cloud logs analysis, data ingestion mapping, and semantic data insights | Enterprise SEOs and data scientists | High cost with a steep learning curve | Auditing enterprise sites of up to millions of pages, debugging crawl budget blocks, and referencing server log files with crawl data |
| Screaming Frog | Technical audits for page-by-page analysis | Technical SEOs and developers | Uses a lot of local RAM on heavy crawls without proper configuration | Scraping page elements on a large scale, running staging site QA deployments, and performing validation checks |
| Moz Pro | Domain Authority rankings, basic keyword tracking, and local visibility metrics | SEO specialists and small agencies | Smaller keyword and link indexes than what you would find with bigger scraping tools | Benchmarking overall site authority profiles and setting up straightforward, low-maintenance client ranking trackers |
| BrightLocal | Local citation mapping, local review distribution measurement, and map pack rankings | Local business owners and multi-location agencies | Doesn’t work for global or ecommerce brands without physical components | Tracking local map positions, enabling multi-location review monitoring, and auditing local citations |
How to Create the Best SEO Report
You may be asking, “What should I include in my SEO report?” Take the following steps to craft a complete SEO report for your business:
1. Define the Audience and the Business Goal
Figure out who your target audience is and what kind of goal you want to achieve.
There are plenty of goals you could set, such as:
- Increasing search rankings
- Getting more site or page traffic
- Boosting conversions
- Increasing sales
2. Validate Measurement
Make sure all of your data sources, tracking tags, and attribution models are accurate and ready to go.
For instance, confirm your GSC properties cover all relevant subdomains and protocol variations, e.g., “http://” vs. “https://.” Also, ensure GA4 tags fire across all key templates and that cross-domain tracking works right.
3. Choose Your KPIs
Based on the goals you set, choose corresponding key performance indicators (KPIs) and metrics to track.
These can include:
| KPI | Source | Definition | Filter Requirements | Denominator |
| Users | GA4 | The number of unique visitors who started a session on your site within a particular timeframe | Session source / medium = google / organic | N/A |
| Sessions | GA4 | The number of distinct visits originating from organic search, ending after 30 minutes of inactivity | Session source / medium = google / organic | N/A |
| Event Counts | GA4 | The number of raw occurrences of specific user interactions or events that start from organic traffic | Session source / medium = google / organic AND Event name = [Specific Event] | N/A |
| Customers | GA4 / CRM | The count of users who completed a defined transactional or bottom-of-funnel event, like closed-won deals or purchases | Session source / medium = google / organic AND Event name = [purchase / conversion / qualification / event] | N/A |
| Session Key Event Rate | GA4 | The percentage of organic search sessions leading to at least one key event | Session source / medium = google / organic | Total organic sessions |
| User Key Event Rate | GA4 | The percentage of unique organic search users who triggered designated events at least once | Session source / medium = google / organic | Total organic users |
Also, document attribution settings and lookback windows where revenue connects to specific channels, which can keep apparently comparable charts from measuring different metrics.
4. Establish Comparisons
Compare the data in your system, including period-over-period measurements, branded vs. non-branded impressions and clicks, share of voice compared to competitors, and device performance, along with performance based on intent and funnel stage.
Also, before reporting, check:
- Tracking changes
- Duplicate events
- Internal traffic
- Missing revenue parameters
- Connector failures
- Incomplete periods
Record extraction dates and limitations.
5. Connect Sources
Once you’ve developed a measurement framework, it’s time to connect all of your data sources.
These could include tools like GSC, GA4, and Semrush for discovery and visibility, GA4 and PageSpeed Insights for user behavior and UX, and HubSpot or Salesforce for tracking business outcomes.
6. Investigate Changes
With your system up and running, look for any changes over time that might reflect anything from algorithm updates to poor optimization. Compare similar data sets to further determine whether things indicate a real problem.
Here are some potential changes to look for:
- Sudden drops in organic traffic
- Declining website impressions
- Reduced organic sessions and engaged sessions
- Dropped organic CTR despite stable keyword rankings
7. Write Conclusions
The best SEO reports will also feature written conclusions based on any findings.
For instance, you might find that your site sees a drop in organic sessions as well as a spike in “Direct” and “Unassigned” traffic channels. Following an investigation into the issue, which involves auditing conversational search referrals and traffic from answer engines like ChatGPT.
The conclusion here would take the form of an action item: Cross-reference landing page entry points; if you see a big surge in direct traffic on deep-funnel content pages, it’s likely that this traffic is coming from AI platforms.
8. Assign Next Actions
Based on the conclusion, you can take action to fix the problem, implementing informed solutions.
From there, you can monitor for future changes and continually optimize your SEO reports.
Tips for Building Effective SEO Reports
Want to build the perfect SEO reports for clients and stakeholders? Here are some helpful tips to keep in mind:
1. Focus on Value, Not Vanity Metrics
While it’s tempting to overload reports with every available data point, the best reports focus on metrics tied directly to business objectives. Clients appreciate seeing how SEO efforts contribute to tangible growth.
2. Tell a Story with Data
Go beyond raw numbers. Use Data Studio to create dynamic, story-driven reports that illustrate not just where your SEO is, but where it’s headed.
3. Incorporate Local SEO Reporting
In 2026, local SEO reporting has become essential. Tools like BrightLocal and Google Business Profile Insights provide location-specific performance metrics that can help you fine-tune your strategy for local markets.
For help with multi-location reporting, consider implementing Rallio to consolidate local social media activity, analytics, and review management workflows. It can supplement other reporting efforts.
4. Conduct Audience-Specific Reporting
Create SEO reports that speak to the right audience, adapting the marketing metrics, visuals, and language to connect with it. For example, business owners will want to see SEO reports that speak to their unique goals as they aim to grow their business, while SEO professionals will be interested in the granular details like backlink profiles and the analysis of SERP features.
5. Glean Actionable Insights
SEO reports shouldn’t stop at simply providing rich data; they should also provide in-depth and actionable insights that indicate where to go to optimize performance. Clients need to have a good idea of how you intend to move forward to continually improve results and achieve specific business goals.
6. Visualize Data
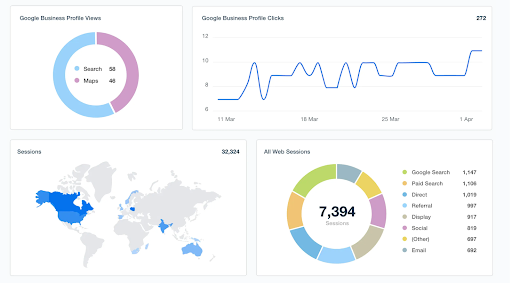
In your weekly or monthly SEO report, visualize the data when needed, especially in SEO reports for clients who aren’t marketing or SEO experts and need more comprehensible results that clearly show performance. Bar graphs, pie charts, and color-coded images can all help different audiences better understand what the data means.
7. Maintain Client Confidentiality and Measurement Safeguards
Anonymize all client examples, keep dashboard access limited, and check all URLs and event parameters for any personal information to maintain users’ privacy.
In fact, Google prohibits sites from sending personally identifiable details to GA4.
If you have healthcare or other sensitive client examples, get an appropriate internal review before you publish any screenshots or customer-level details.
Why Don’t Search Console Clicks Match GA4 Sessions?
You might notice that Google Search Console and GA4 show different metrics.
While both analyze search traffic, they use differing tracking methods and data structures.
Google Search Console measures behavior on search engine results pages (SERPs) like clicks and impressions, while GA4 looks at behavior once those people visit a page.
They also pull data from different sources, with GA4 capturing all traffic sources, from organic to paid and direct, while GSC only accounts for Google Search clicks and impressions.
In addition, GA4 uses JavaScript snippets for tracking, meaning it can miss users with disabled JavaScript, ad blockers, or privacy extensions. Conversely, GSC records all search events regardless of these factors.
Canonical alignment is also different; GA4 logs the specific URL the user landed on, including UTM tracking parameters, whereas GSC aggregates all data under a canonical URL that Google chooses.
Finally, GSC and GA4 use different time zones, which can affect daily reporting comparisons. GSC reports data in Pacific Time, while GA4 uses the time zone set for the property. Consent Mode can also create discrepancies, as it affects how GA4 collects and models data when users decline or limit consent. These differences are important to consider when comparing performance across both platforms.
So, before investigating any discrepancies in clicks and sessions, match dates, countries, devices, and organic filters.
SEO Reporting Template
Here’s a template to help you develop a complete SEO report, along with a hypothetical example:
Executive Summary
In September 2026, our SEO strategy focused on maximizing and stabilizing transactional keyword visibility while expanding the brand’s presence into AI and other alternative search experiences. Organic search produced $300,000 in attributed pipeline data the following month, demonstrating a 15% YoY increase.
Content expansion for targeted page groups led to more consistent keyword visibility during periods that would normally see poorer results. Increased citation rates in AI Overviews and native generative search modules resulted in better non-branded search visibility, although mobile conversion rates decreased slightly because of checkout friction.
KPI Scorecard
| Primary KPI | Current Month | Prior Month (MoM) | Prior Year (YoY) | Target Goal | Status |
| Organic Revenue/Pipeline | $300,000 | +4.5% | +15% | $285,000 | Exceeded |
| Organic Conversions | 2,140 | +6.1% | +22.5% | 2,000 | Exceeded |
| Non-Branded Sessions | 142,000 | +8.5% | +18.2% | 135,000 | Exceeded |
| AI Share of Voice | 12.4% | +1.1% | N/A | 10% | Exceeded |
| Average Organic CTR | 3.1% | -1% | -0.5% | 3.5% | At Risk |
| Core Web Vitals Pass Rate | 94% | +2% | +15% | 95% | On Track |
Organic Acquisition
Organic acquisition channels experienced ample top-of-funnel expansion backed by non-branded programmatic adjustments.
Non-branded queries represented 68% of all organic acquisitions, indicating success at winning new customer interest. Meanwhile, the CTR flattened to a small degree despite 21% more impressions, which was due to a higher volume of interactive map modules and layouts accounting for most competitive transactional results.
We also saw more conversational search referrals from Perplexity, ChatGPT, and other generative engines with an 11% MoM, indicating off-page authority strategies are working properly.
Landing Page Outcomes
We looked at landing page performance based on intent, which included:
- Commercial ($195,000 Generated): Bottom-of-funnel product and service pages held a 4.8% conversion rate, with high transactional intent.
- Localized Demand ($55,000 Generated): Location-specific geo pages captured plenty of hyper-local intent, leading to a 33% boost in unique sessions and turning local traffic into appointment bookings.
- Informational ($50,000 Generated): Top-of-funnel pages, including blog posts and guides, saw a high number of impressions while average engagement time suffered. Internal links are essential for moving more users toward conversion through these pages.
Search Visibility
Positioning across search platforms demonstrated upward trends, including:
- Better keyword positioning for core non-branded commercial terms in positions 4-10, resulting in a 72% increase in page-one rankings for competitive keyword groups.
- A 60% increase in generative search visibility, with many citations positioning the brand as a primary informational resource in summary cards and overviews.
- Increased cross-platform visibility following verified social profile integration and targeted video assets.
Technical Priorities
There are a few primary technical SEO fixes the brand has implemented and must continue to implement:
- Interaction to Next Paint (INP) Remediation: We resolved script execution delays on mobile checkout flows, leading to reduced mobile interactive latency by 45ms and a 94% Core Web Vitals compliance rate.
- Crawl Budget and Render Optimization: Removing redundant redirect loops in subfolders helped search engine crawlers find freshly updated templates.
- Schema Layer Deployment: Updated schema structured data on local property templates enabled data synchronization with conversational scraping parameters and map engines.
Completed Work
Completed tasks for this strategy included:
- Launching core local layouts, including specialized service page frameworks targeting hyper-local audiences.
- Metadata optimization involving improving 150+ low-CTR title tags and meta descriptions to improve visual search and encourage more clicks.
- Internal linking alignment with contextual link blocks from high-authority informational blog assets leading into commercial pages.
- Social asset integration with multi-platform social video feeds improving multimodal SEO footprints.
Next Steps
Next steps for the brand strategy entail:
- Scalable Localized Expansion: We will run a comprehensive localized service page expansion process to capture hyper-local intent for all relevant service areas.
- Generative Optimization Alignment: We plan to audit text blocks on informational pages struggling to get AI citations, improving content structure and updating details as needed.
- Friction Reduction for Mobile UX: The dev team will execute a full-funnel checkout path optimization to improve mobile transaction volume based on our desktop benchmarks.
- Link Equity Re-routing: We will monitor high-impression pages, implementing secondary call-to-actions that convert passive informational traffic into qualified leads and sales.
How to Report on AI Search Visibility
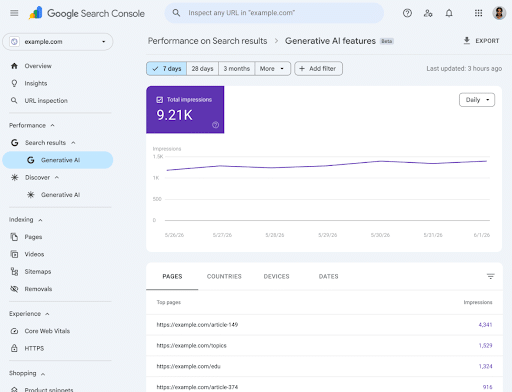
The best SEO ranking reports can now gauge AI visibility in addition to traditional search. In June 2026, Google introduced its own Search Generative AI performance reporting capability, with the feature rolling out worldwide on August 31, 2026.
This SEO reporting capability shows impressions from both Google AI Overviews and AI Mode, with dimensions like page, country, date, and device. The availability of this data depends on the volume of impressions.
Limits of AI Search Visibility
You may not get a complete SEO report with AI reporting, as AI impressions are different from site visits, leads, and revenue. The recently added GSC report solely documents impressions instead of click-throughs and conversions.
Also, keep in mind that these impressions contribute to broader Search reporting, making it important to avoid including them in existing totals.
Separate SEO reporting can help you track identifiable AI referral traffic. However, referral tracking won’t capture every AI-assisted visit. Many appear as direct or unassigned traffic, so treat referral data as a baseline rather than the full picture.
SEO Reporting FAQs
1. What is the best tool for SEO reporting?
There’s no one-size-fits-all answer! It depends on your needs and budget. All-in-one tools like SEMrush or Ahrefs manage campaigns, find keywords, suggest content, and track competitors – all from a single platform. These are great for comprehensive SEO strategies.
2. Why should I use an SEO reporting tool?
Imagine trying to navigate the SEO world without a map. These tools act as your guide, helping you track progress and identify areas for improvement. By measuring specific KPIs, you can see the impact of your SEO efforts and make data-driven decisions to optimize your website’s performance.
3. What are the different parts of SEO reports marketers should create?
- SEO Audit Report: This is your website’s health check, analyzing things like search engine ranking positions, domain authority, and the number of unique pages on your site. It helps you understand overall website progress over time.
- Keyword and Competitor Analysis Report: This report dives into keywords, uncovering potential opportunities and keeping a pulse on what your competitors are targeting. It helps you stay ahead of the curve.
- Traffic and Ranking Report: This report focuses on organic search ranking and traffic data, showing you how well your website is attracting visitors through search engines. By analyzing click-through rates and other metrics, you can refine your SEO strategy for optimal results.
4. How do I handle local SEO reporting?
Here are some tips for producing local SEO reports:
- Include location-specific keywords – Make sure that your keyword reports include relevant location names. For example: “Dentist in Columbus” or “Raleigh plumber.”
- Focus on devices – Often, people searching for local businesses do so with a mobile device. Make sure your reporting includes a breakdown of reach by device.
- Use local-specific tools—BrightLocal, Moz Local, and Whitespark can help you monitor local keyword rankings, citation coverage, and business listing accuracy. Use these tools to track local visibility, NAP (name, address, and phone number) consistency, and competitor performance.
- Monitor reviews and customer sentiment—Your Google Business Profile plays an important role in local visibility and customer trust. Include review volume, average ratings, and customer feedback in your reporting. Tools like Sprout Social support review monitoring across Google, Yelp, Facebook, and other platforms. For broader social listening, Brandwatch can help you monitor brand mentions across social networks, forums, blogs, and supported review sites.
Remember that call metrics count as call button clicks and not confirmed conversations, and that direction requests don’t qualify as verified store visits. Performance reports in Google Business Profile can also include activity from organic results and Google Ads, helping determine how SEO and paid media efforts work together.
In addition to network totals, count location-level leads, appointments, landing page performance, and local visibility to gauge the effectiveness of local marketing. And be sure to compare the same set of locations over time to keep new openings from hiding the declining performance of existing locations.
You must also document search locations, grid coverage, keywords, and collection dates for accurate geographic keyword tracking; city names in keywords alone won’t contribute sufficiently to an SEO keyword report.
5. Should you hire an in-house SEO team?
SEO reports can tell you the best way to produce content, but they’re not going to produce content for you.
In-house SEO teams are not right for all businesses. You could also hire a digital marketing agency to produce a tailored SEO report and action plan, work with a freelancer to provide insight and guide SEO deliverables, or have your marketing team go off of a third-party SEO tool to develop your future strategy.
6. What should an SEO report include?
Asking, “What should I include in my SEO report?” There are several key elements: business outcomes and conversions, acquisition and search visibility, and diagnostic and technical health, all of which will give you a comprehensive overview in a complete SEO report.
7. How often should you report?
Ideally, you should have ongoing monitoring for fluctuations, monthly reporting, and quarterly strategy review.
8. Why do GA4 and Search Console disagree?
Both of these tools are fundamentally different, with Search Console looking at data directly from Google Search, while GA4 measures things at the browser level to see how people interact with a site after that initial click-through. As such, their metrics will never perfectly match.
9. How do you measure qualified leads and ROI?
You can measure qualified leads in terms of marketing- vs. sales-qualified leads (MQLs vs. SQLs), with MQLs being leads meeting baseline criteria for continued marketing, while SQLs are leads that move past that point and are ready to close. You can then track SEO ROI with the following formula: Financial Value of Organic Search – Total SEO Investments / Total SEO Investments X 100.
10. How do you report AI search visibility?
You can measure AI search visibility in an SEO report by looking to see how many times your pages appear in citations and brand mentions, measuring metrics like AI impressions, citation share of voice, and AI referral sessions and conversions using tools like Google Analytics 4.
See Clear Results with Ignite Visibility’s SEO Reporting
SEO reporting in 2026 is about more than just showing data; it’s about telling a compelling story of growth and opportunity.
Whether you’re delivering #1-ranked quarterly SEO reports or integrating the latest tools like GA4 and Data Studio, your reports can provide clients with clear, actionable insights.
By focusing on what truly matters—traffic, conversions, and content optimization—you’ll not only retain clients but also set them up for continued success.
Need help connecting SEO performance with business outcomes? Explore Ignite Visibility’s reporting and analytics services for custom dashboards and measurement support.