
Want the key to ranking higher on Google?
It’s in your user behavior metrics!
Let’s look at what your user behavior metrics are, how you can analyze them, and how you can use the data to improve your ranking.
What You’ll Learn
What Are User Behavior Metrics?
What Are User Behavior Metrics?
User behavior metrics tell us how a user interacts with your page.
By studying them, you can better understand how many people are interacting with your site, which pages bring them to the site in the first place, and which pages they engage with the most.
But beyond the (invaluable) insight, user behavior metrics also play a part in how Google ranks your page in the SERPs.
More specifically, it affects your rankings from a relevant point of view.
Over time, Google has begun to put more emphasis on “relevancy rankings,” which means that Google takes the relevance of a page into consideration when deciding rank.
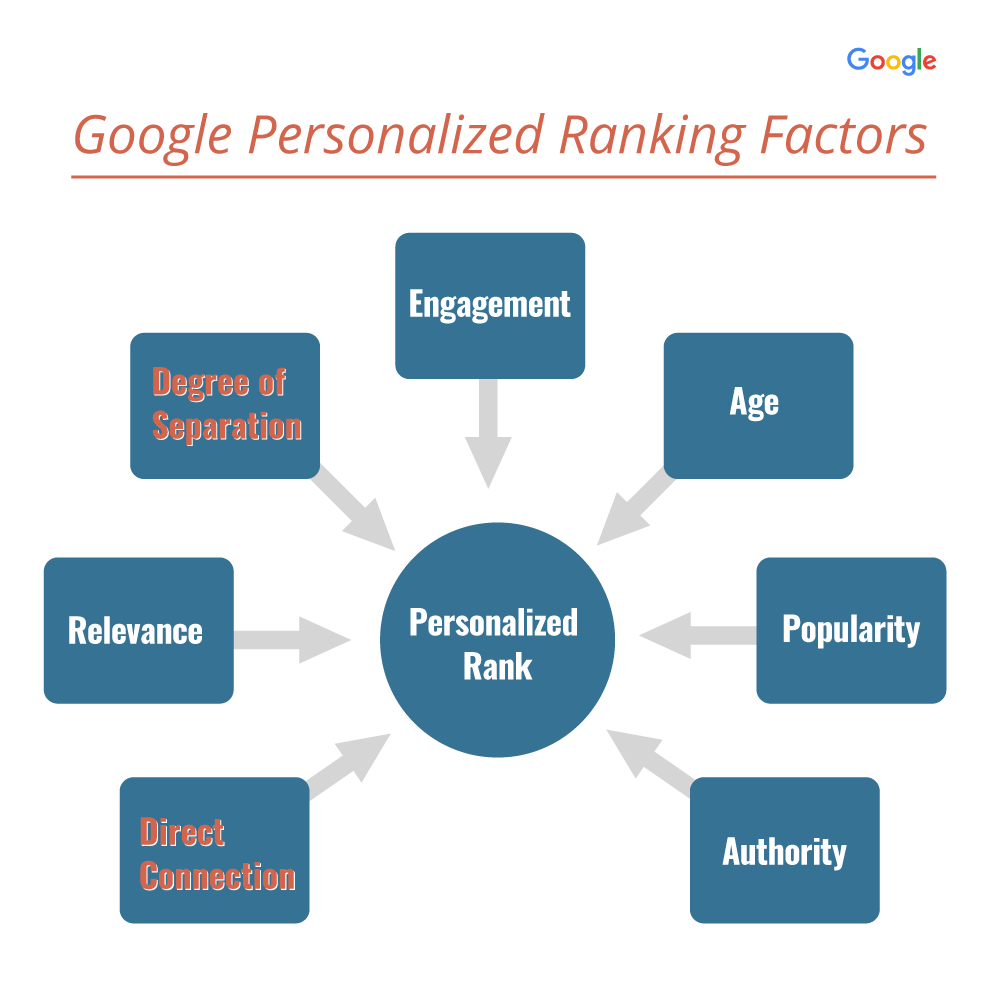
Why? Because a user interacting well with your page indicates that it is indeed relevant to the user’s given search query.
It makes sense, really.
See, Google is all about improving the user experience. And part of that experience is finding the most relevant results to match a given user’s search query.
How they determine that relevancy relies heavily on user behavior. If one particular page is continuously clicked on more and sees higher engagement times than competing pages, that signals to Google that users are finding what they were looking for on that page.
In turn, Google will want to bump that page up in the results because user behavior indicates it was more relevant than other pages.
This isn’t just speculation, either.
Though demystifying the Google algorithm often involves a lot of guesswork, we have it on record that user behavior plays a part in rank.
Google’s former Search Quality Chief Udi Manber is on record as saying:
“The ranking itself is affected by the click data. If we discover that, for a particular query, hypothetically, 80 percent of people click on Result No. 2 and only 10 percent click on Result No. 1, after a while we figure probably Result 2 is the one people want. So we’ll switch it.”
Which User Behavior Metrics Matter Most
So, it’s pretty clear user behavior plays a role in rank.
This means that to excel in modern SEO, you need a strategy that actively works to monitor and improve user behavior.
Because no matter how much traffic your site is getting, if users aren’t finding the information they need, they won’t continue to engage with it.
Eventually, Google will take notice. And in return, your overall rankings could suffer.
To understand how to better get into Google’s good graces, you need to know the specific metrics they’re looking at to determine user behavior and relevance.
Here’s what you need to focus on – and tips on how to improve.
User Behavior Metrics: Click-Through Rate
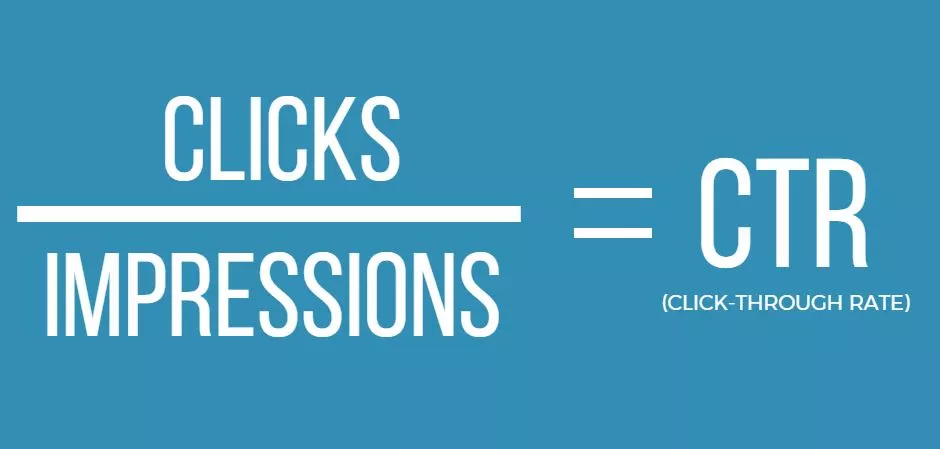
Click-through rate (CTR) measures how many people click a link vs. the total members of users who saw it.
The breakdown looks like this: CTR = clicks/impressions.
This is a big one with Google.
As Udi Manber confirmed, clicks definitely have an impact on which pages rank highest.
Why? Because in Google’s eyes, each click acts as a vote of confidence for a given page. It means that of all the pages that appeared in a user’s search results, this was the one they picked as the best match.
Naturally, the more clicks a page gets, the more relevant it appears to Google.
How to Find Your Click-Through Rate
To find your CTR, simply log into Google Search Console.
At the very top, you’ll see a block of numbers. The third one over shows the average CTR for your entire site.
Below that, you can find individual URLs and their metrics.
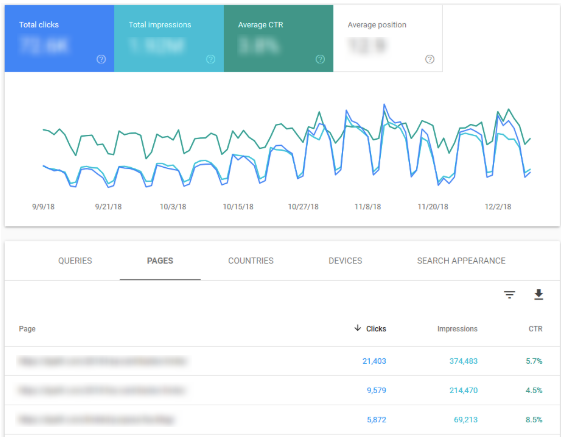
Look at your top pages and make sure the CTR is high, and also find important pages performing under the average CTR.
Need a step-by-step guide? Check out this guest post by CEO John Lincoln: How to Manage CTRs with Google Search Console
How to Improve Your CTR
Any pages that are underperforming in terms of CTR will need some attention.
To improve, you’ll want to focus on the following.
1. Focus on Optimization
Higher rankings have higher CTRs.
Like, seriously higher CTRs.
Take a look at this: on this first page of search results, the first five results account for 67.60% of all clicks. The results in the 6-10 position? Receive just 3.73%.
In our own study, we found the breakdown looked something like this:
- Position 1 – 20.5%
- Position 2 – 13.32%
- Position 3 – 13.14%
- Position 4 – 8.98%
- Position 5 – 9.21%
- Position 6 – 6.73%
- Position 7 – 7.61%
- Position 8 – 6.92%
- Position 9 – 5.52%
- Position 10 – 7.95%
Pretty major, right?
That’s why it’s so important to focus on optimizing the content on your website, which includes everything from keyword research and link building to perfecting your technical SEO.
The catch up on the latest SEO trends for 2022, check out our recently released list!
2. Look at SERP Features
SERP features have taken some of the glory from organic results.
They’re the enhanced features (like rich snippets, knowledge graph, stars, breadcrumb links, etc.) that typically appear near the very top of the results page.
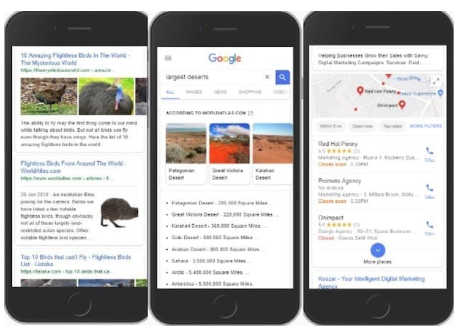
Because of that, simply optimizing for the #1 position won’t necessarily give your content the boost it used to. Instead, you also need to be optimizing for SERP features.
SERP features are available for different queries, and making your listing stand out is important.
See if there is any applicable schema that can be added to your content and analyze SERPs for your money keywords to see what you can do.
Not exactly sure where to start? Find out how and optimize for SERP features here.
3. Title Tag and Description
Title tags and descriptions have always been important for rankings.

Now, they’re also important for click-through rates.
If you have a really low CTR on a page that ranks well, try changing the title tag and description. Monitor it for two weeks to see if the CTR improved.
Or, try incorporating any paid media data you may have on phrases that convert well or have high clicks.
User Behavior Metrics: Time on Page
Time on Page is the average amount of time a user spends on a page.
This can give us significant insight into the content of our page, and whether or not a user who visits finds it relevant or not.
A low time on page can signal that the content isn’t matching user intent and not aligning with a searcher’s query. All of which is bad news in Google’s book.
On the flip side, the higher the time on site, the more relevant a user likely found your content.
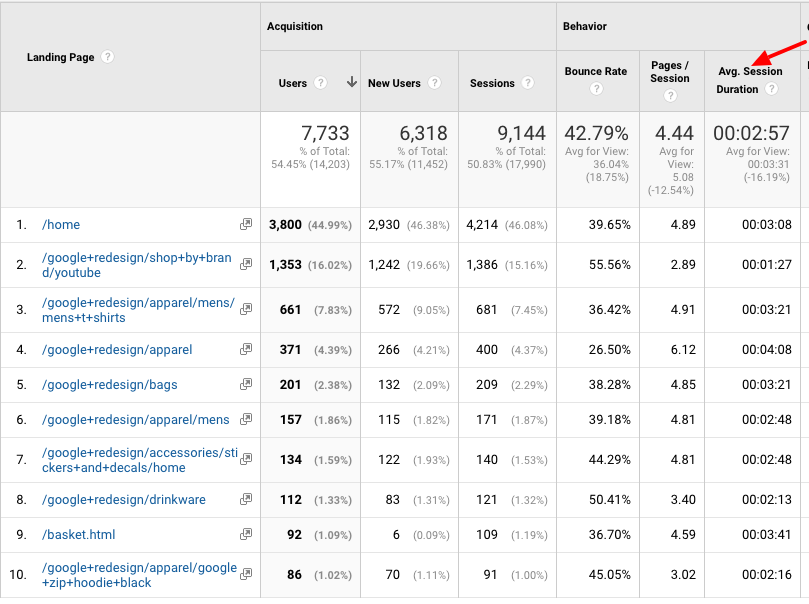
How to Find Your Time on Page
For this one, you’ll need to log into your Google Analytics account.
Select Acquisition from the left-hand menu, and then choose All Traffic > Channels.
Once there, select Organic, and choose Landing Page View (it will be under the Avg. Session Duration column).
Make sure you set a large date-time range to return enough data. I recommend at least a month or so.
How to Improve Time on Page
With this one, it really comes down to improving the overall user experience.
1. Make the Page More Interactive
One of the best ways to engage users is by adding interactive elements like images, videos, FAQs, etc.
The idea here is that you want to give users a full, in-depth resource on their original search query.
Take a look at your page and see where it may be lacking – is it too text heavy? Are you missing any major points relevant to the topic?
Also, take a look at your competitor’s similar pages to see what they might be including that you’re not.
Consider everything from the look and feel of the page to the tone of your text. If it’s not something that will resonate with your audience, you should consider revamping it.
2. Keep Your Goal in Mind
In some cases, a low time on page isn’t necessarily a bad thing.
Depending on the overall goal of the page, it could, in some cases, signal good news.
For example, If it’s a page where you want people to convert and you did some conversion rate optimization (CRO), your goal is conversion. If conversions are up but the average session duration is down, this doesn’t mean it’s bad.
Instead, It could mean people are finding the CTA faster because of effective CRO, and therefore not wasting as much time on the page.
In some cases, you may just have a page that doesn’t warrant a high time on page. So always consider the objective of each page.
If it’s a shorter infographic that’s easy to digest, your time on page will naturally be lower. But if you’re offering an in-depth article that generally takes 5 minutes or so to read, the time on page metric should speak to that.
3. Pro Tip – Increase Your Use of Video Content
Video content is taking the digital marketing industry by storm. Thanks to the rise of platforms like TikTok and Instagram Reels, users are craving video content.
In fact, it’s estimated that video content will make up more than 82% of all consumer internet traffic in 2022.
Why not use that to your advantage?
Video content will make your page more interactive, informative, and fun. It will make users want to stay on your page longer, which increases your Time on Page.
It also allows you to rank in video searches and other SERP features for featured videos or carousels. By providing this content, you’re giving search engines another place to rank you and users another place to find you.

User Behavior Metrics: Bounce Rate
At first glance, bounce rate seems similar time on page.
And while it is similar, bounce rate specifically measures the percentage of visitors who come to your site but leave without visiting any other pages.
So, if you have a bounce rate of 70%, that means 70% of visitors are only seeing that one page. They’re not exploring your menu options, clicking any links in your content, or otherwise interacting with the rest of your site.
Like time on site, this usually signals that either a.) your website just wasn’t engaging enough, or b.) you were attracting the wrong kind of visitor.
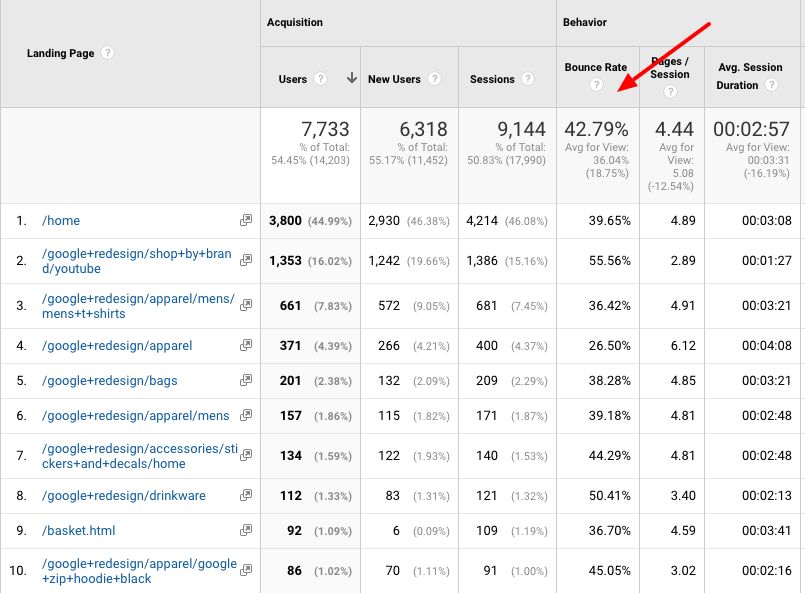
How to Find Your Bounce Rate
You’ll also find your bounce rate in Google Analytics.
Cool thing is, it’s located just two columns over from your Average Session metric.
Remember, that’s All Traffic > Channels > Organic > Landing Page View.
How to Improve Your Bounce Rate
All the points pertaining to time on page apply here, which means and first and foremost you need to take a hard look at the overall user experience your page provides.
Additionally, the following can affect a page’s bounce rate.
1. Make Your Content Skimmable
Regardless of your industry, user attention spans are low. You only have a few seconds to grab and capture their eye.
Keep their attention on your page by making it clear that they are where they should be.
Make it obvious that your content answers their questions.
Use clear and concise headers to avoid any confusion, and make sure the content is easily digestible.
Long blocks of text deter users and often cause them to bounce because they feel overwhelmed by the sheer amount of words on the page. Keep them on your page with a lot of descriptive subheadings, bullet points, and short paragraphs.
The key here is to produce content that’s easily skimmable.
It’s rare that you’ll find a word-for-word webpage reader, so do them (and yourself) a favor by providing a clear content path and making any major points stand out.
Along those same lines, make sure your content is grammatically correct and error-free. One misspelling or missed comma could throw a reader off and make a source seem less authoritative. All of which could very well result in a bounce.
Again, images, videos, and infographics come in handy here to help break up text and provide more visual appeal.
2. Optimize Your Page Speed
Users won’t wait around for your slow website to load.
In fact, they’ll wait an average of 4 seconds before they bounce right back to the search results.
Not a lot of time to work with, but it’s incredibly important that you do everything you can to meet that expectation.
That means making sure your images are properly sized and optimized, you’re using a reliable hosting, and you’re not overusing redirects, among other things.
If you’re seeing an overly high bounce rate, your page speed is one of the first things to check.
3. Stay On Topic
Another reason people bounce? A page simply isn’t holding up its end of the bargain.
Getting your page ranked highly for a keyword is fantastic but if you draw users to your page, only to deliver content that is not servicing your users’ requested intent, they will bounce.
It also will harm your credibility in the future, as your domain will start to be used as a bait-and-switch type site and not one that actually delivers the appropriate content.
The last thing you want is a user who feels misled by your page title or description, as that again signals that the content doesn’t match what was represented in the SERPs.
4. Pro Tip – Install a Heat Map Tracking Tool
One of the best ways to know what is resonating with your audience is to install an outside heat map tracking tool, like Hot Jar.
This plug-in will give you information such as:
- How far down your site users typically scroll
- Where they usually click
- What sections of your page gets the most attention
- How users interact with your site
This information is all very helpful when you’re designing your content strategy because it will allow you to build a page that resonates more with your users’ usage and not just your best guesses.
Wrapping Up User Behavior Metrics
If you want to rank high in Google, you can’t afford to ignore your user behavior metrics.
You can learn a lot about your content, how its resonating, and how to improve it by analyzing the data you receive from these metrics.
When you build a page that solves more problems and answers more questions, you’re more like to have a page that, not only receives a lot of traffic, but also ends up producing a lot of conversions.