
Have you explored Google Search Console? If you haven’t, you’re missing a wealth of valuable, free insights on how to improve your online presence and SEO strategy.
In this article, Anthony DiSalvo, Sr. SEO Project Manager, explain the benefits of Google Console webmaster tools, what’s changed recently, and break down each of the reports and how they’re used for SEO.
What You’ll Learn:
- What is Google Search Console?
- How to Set Up & Verify Your Site on Google Search Console
- Understanding Google Search Console Performance Reports
- The Importance of Clicks vs Impressions
- Advanced Analysis & Filters
- URL Inspection Tool: When & How to Use
- Common Integrations
- Actionable SEO Workflows Using GSC Data
- Common Mistakes to Avoid with GSC
- Google Search Console Glossary
- FAQs
What is Google Search Console?
Google Search Console is a free tool direct from Google that gives you valuable insights into how your site is performing in Google’s Search Results, as well as how to improve it.
Thanks to Google Search Console, you can:
- Inform Google when you publish new content so it can be indexed more quickly.
- Remove content from Google’s search index that you’ve deleted from your website.
- Track Performance to see which search terms are drawing people to your website.
- Learn whether your site is infected with malware or spam.
- Find out if your product schema makes it into rich results
- Receive a warning if your Accelerated Mobile Pages (AMP) are non-compliant.
- See which websites are linked to yours.
- Determine whether mobile users are having trouble accessing your site.
- Gain a better understanding of your website visibility.
- View how Google crawls and renders your webpages.
- Track Core Web Vitals performance for page speed review.
- Review google product snippets and merchant listings for opportunities.
You can use all of this knowledge to improve your site – both for Google crawlers and your end users.
Expert Opinion on SEO and the Google Search Console
One of the most indispensable tools for SEO? Google Search Console.
It’s a tool most SEO professionals can’t live without, especially when it comes to maximizing your website’s organic performance.
As someone who’s worked extensively with search optimization, I can confidently say that GSC provides unparalleled insights directly from Google itself, including showing you exactly how the search engine views your site, which queries drive traffic, and where technical issues might be holding you back.
The performance reports reveal the actual search terms people use to find your content, allowing you to refine your keyword strategy based on real user behavior rather than guesswork. Beyond rankings and clicks, the platform’s Index Coverage reports and Core Web Vitals data give you a comprehensive health check of your site’s technical SEO, highlighting crawl errors, mobile usability issues, and page experience metrics that directly impact your search visibility.
While many third-party tools offer valuable data, none can replace the direct line of communication that Search Console provides between your website and Google’s algorithms, making it an essential foundation for any data-driven SEO strategy.

How to Set Up & Verify Your Site on Google Search Console
When you’re ready to set up Google Search Console for your website, you’re going to have to do some technical stuff.
It’s understandable if you’re not up to that task. In that case, you’ll have to hire a professional.
Start by visiting the Google Search Console log in page and signing in with your Google account.
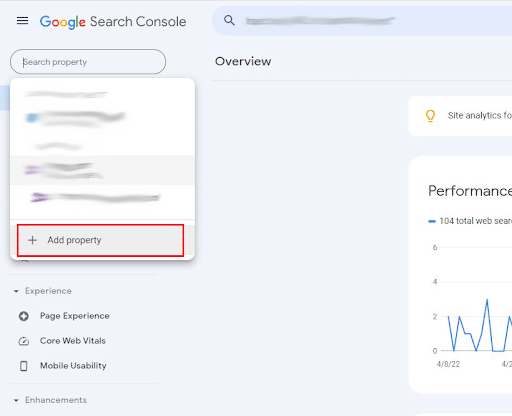
Once you’re signed in, click “Add A Property” in the upper, left-hand corner.
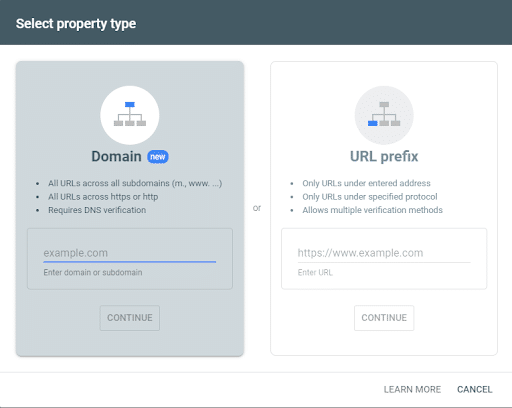
When you begin setting up your Google Search Console account, you’ll be prompted to choose between two property types: domain property or URL prefix property.
Domain Property:
A domain property verifies and manages all URLs on your website across all subdomains and protocols. This comprehensive approach includes:
- https://yourdomain.com
- http://yourdomain.com
- https://www.yourdomain.com
- http://www.yourdomain.com
- All other subdomains (blog.yourdomain.com, shop.yourdomain.com, etc.)
URL Prefix Property:
A URL prefix property tracks and reports data for one specific URL path and its related subdirectories. This means data will only be tracked for one protocol and one specific domain version, such as https://www.yourdomain.com or a specific subfolder like https://yourdomain.com/blog. For SEO’s, access here is needed if you want to use the disavow links too to remove spammy links from your website.
Once you’ve typed in the site URL, click “Continue.”
Now you’ll need to prove ownership of the website you entered. Google will show you the easiest method by default, which is uploading a simple HTML verification file to your site.
Once you’ve uploaded the file, click the confirmation link and Google Search Console will validate the existence of the file. Then, you’re all set up!
If, for whatever reason, you can’t upload a file to your website, you still have a few options to prove that you own the domain:
- An HTML Tag – put a meta tag in the homepage of your website
- Domain Name Provider – sign in to your domain name provider
- Google Analytics – use your Google Analytics code to validate ownership
- Google Tag Manager – use your Google Tag Manager account to validate ownership
You’ll have to use one of those five options to convince Google you’re the owner of your domain.
Set Up Owners, Users, and Permissions
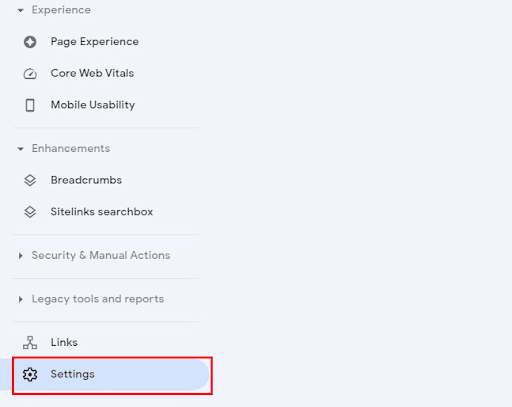
To set up permissions in Google Search Console, go to “Settings” in the bottom-left corner.
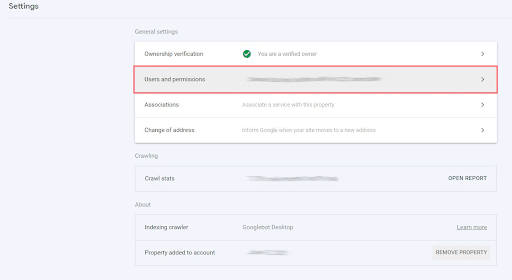
Then, select “Users and permissions.”
From there, you can select “Add User” to give any Google account permission to access that property.
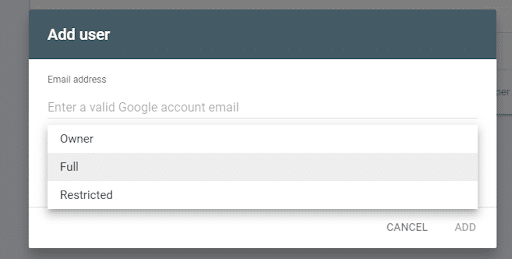
The “Add User” pop-up will allow you to adjust permissions for each account you add to the property.
Property owners have full control and can add other users with different permission levels:
- Owner – Full control including adding/removing users
- Full user – Can view all data and take most actions
- Restricted user – Can view most data but cannot add users or manage some settings
How to Submit a Sitemap to Google Search Console
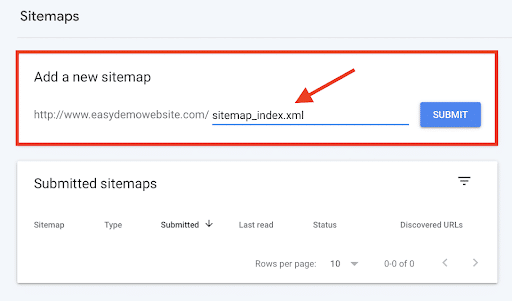
To submit your property’s sitemap to GSC, click on “Sitemaps” under “Index” in the left-hand menu.
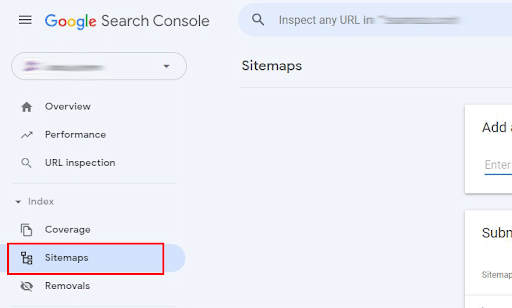
Then, all you need to do is paste the URL of your sitemap in the submission form.
Dimension and Metrics
Before starting your Google console search, it’s important to know that there are six performance dimensions to measure your site’s success in Google search:
- Queries: queries are search terms that generate impressions of your site page on Google
- Pages: Your top-performing web pages
- Countries: Top-performing countries for your website
- Devices: Shows how your site performs in mobile, desktop, and tablet searches
- Search appearance: Shows your site’s appearance in different rich results
- Dates: Organizes your clicks and impressions by date
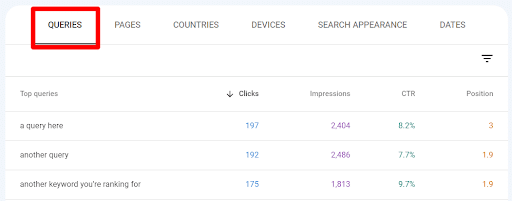
You can qualify those dimensions with four different performance metrics:
- Total clicks: The amount of clicks a page receives
- Total impressions: The amount of times a page appears in Google SERPs
- Average CTR: The average click-through rate a page earns
- Average position: How “high” a page appears in Google SERPs, relative to its closeness to the #1 spot
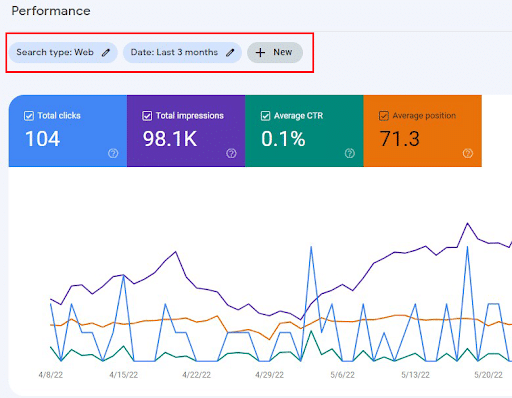
Filters
Search Console allows you to filter your performance with seven different criteria:
- Search type
- Date
- Query
- Page
- Country
- Device
- Search appearance
You can access these filters on the “Performance” page.
Understanding Google Search Console Performance Reports
Now that you’ve set up your Google Search Console, let’s talk about how to understand the metrics you’ll be getting.
Here are the most important reports in the Google Console webmaster tools.
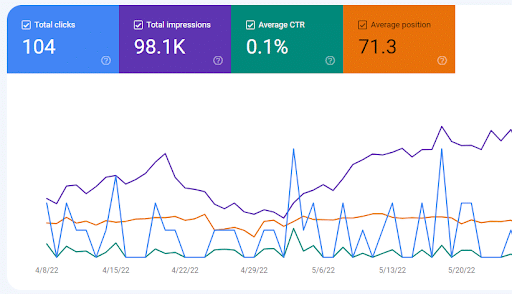
Performance Report
Think of the Performance Report as a treasure map showing exactly which words people type to discover you. This report tracks the four essential metrics that tell the complete story of your search presence: clicks, impressions, click-through rate (CTR), and position.
By analyzing these KPIs, you can identify content gaps, improve your titles and descriptions, and use the comparison feature to track progress over time.
The Importance of Clicks vs Impressions
Clicks: Organic Clicks are important for understanding where users are landing on your website. Clicks from pages and queries will tell you where you are succeeding and what areas of your website need improvement. You can use this click information to drive your SEO strategies and make decisions on what you want to target.
Impressions: In an age of increasing zero-click search, Impressions are more important than ever before. Websites are getting less clicks, but being seen more due to new Google AI Overviews and Google features such as PAA and Things to Know ranking opportunities. Google impressions help you understand whether your website is visible for the queries you are targeting.
Coverage Report: Sitemap & Indexing
Your sitemap is like a roadmap you give to Google. It lists all the pages you want Google to index and helps them find them efficiently.
The Coverage Report (now called “Page Indexing” in the updated interface) shows you which pages Google successfully indexed and which ones hit roadblocks. Pages are sorted into categories:
- Indexed successfully
- Excluded for various reasons
- Blocked by errors
This report is critical because a page that isn’t indexed can’t rank, no matter how amazing your content is.
Common coverage errors pop up regularly, but they’re usually fixable:
- Submitted URL marked ‘noindex’: Your page has a tag telling Google not to index it. Check your page settings or plugins.
- Page with redirect: means that the URL redirects to another page, and Google indexed the destination instead.
- Soft 404: happens when your page returns a success code but displays an error page, typically due to thin content or missing pages.
- Crawled – currently not indexed: means Google found your page but decided not to index it, often due to low quality or duplicate content.
To resolve these issues, click any error category to view affected URLs. Review each page and make necessary changes, including removing noindex tags, improving content quality, fixing redirects, or consolidating duplicate pages.
After fixing, use the “Validate Fix” button to request that Google recheck. Validation can take days or weeks, so patience is key.
Core Web Vitals & Experience Reports
Core Web Vitals measure how real users experience your website’s speed and stability. Google uses these metrics as ranking factors because it prioritizes user experience. If your site is slow or jumpy, people bounce and Google notices.

- Largest Contentful Paint (LCP) measures loading speed. Specifically, it tracks how long it takes for the biggest visible element to appear on screen. This might be a hero image, headline, or video. Good LCP is under 2.5 seconds. Slow LCP frustrates visitors who want information now.
- First Input Delay (FID) and its newer replacement, Interaction to Next Paint (INP) measure responsiveness. They track how quickly your page reacts when someone clicks a button or taps a link. Good FID is under 100 milliseconds; good INP is under 200 milliseconds.
- Cumulative Layout Shift (CLS) measures visual stability. It tracks annoying situations where content jumps around while loading, like when you try to click something and an ad loads, shifting everything down. Good CLS is under 0.1.
Google Search Console’s Core Web Vitals report shows you which URLs have poor, needs improvement, or good experiences. The data comes from real Chrome users visiting your site (called field data). Click “Poor URLs” to see which specific pages are failing these tests. Group pages by similar issues to fix problems in batches.
To improve these metrics using GSC data, start with your most important pages: homepage, top landing pages, and conversion pages.
- Slow LCP: compress images, use a faster hosting provider, and remove render-blocking resources
- Poor INP: reduce JavaScript, optimize third-party scripts, and minimize main-thread work.
- High CLS: add size attributes to images and videos, avoid inserting content above existing content, and use transform animations instead of property changes.
Connect your GSC data with PageSpeed Insights for detailed recommendations. Copy struggling URLs from GSC, paste them into PageSpeed Insights, and follow the specific suggestions. This combination of real-user data (from GSC) and lab testing (from PageSpeed) provides a complete picture.
Links Report: Internal & External
The Links Report shows who links to your website and how your pages link to one another. These connections are like votes of confidence. They tell Google which content matters most and help distribute authority throughout your site.
The External Links section shows websites linking to yours:
- Top linking sites shows which domains mention you most. High-quality links from relevant, authoritative sites boost your rankings significantly.
- Top linked pages will help you discover which of your pages attract the most backlinks. Often, you’ll find surprising content that earns links, such as an old blog post or resource page. Double down on promoting these natural link magnets.
The Internal Links section shows how your pages connect to one another.
“Top linked pages” shows which pages receive the most internal links. It provides insight into what your site architecture emphasizes. If an important product or service page has very few internal links, it’s harder for Google and users to find.
Use this data to spot linking opportunities. Find important pages with few internal links and look for relevant places to link to them from higher-traffic pages.
For example, if you wrote a comprehensive guide but it has only 3 internal links, find 5-10 existing blog posts where you could naturally reference it. More internal links help Google understand the importance and improve crawl efficiency.
Also review the “Top linking text” section to see which anchor text people use when linking to you. This shows you how others perceive your brand and content. If the anchor text doesn’t match your target keywords, you might need clearer positioning or content updates.
Advanced Analysis & Filters
Filters and segments transform raw data into actionable insights. Instead of viewing overall performance, you can zoom in on specific user groups, locations, or time periods to understand exactly what’s working and what needs attention.
Let’s look at some of the most important filters.
Device
This filter shows how your site performs on desktop, mobile, and tablet.
Click the “Search type” tab, then compare devices. You’ll often discover mobile rankings lag behind desktop or vice versa.
Mobile-first indexing means Google primarily uses your mobile version for ranking, so mobile performance is critical. If mobile clicks are down but desktop is strong, check your mobile experience and speed.
Country
The Country filter reveals geographic performance. Select “Countries” under the default query view to see which nations send you traffic.
If you serve multiple regions, this helps identify growth opportunities. For example, if Germany shows high impressions but low clicks, translate your titles or create German-specific content.
For local businesses, focus on your target country and ignore irrelevant international traffic.
Date Range
The Date Range comparison unlocks trend analysis. Click the date selector and choose “Compare” to see two time periods side by side. Compare this month to last month, or this year to last year. Look for queries gaining or losing traction.
Seasonal businesses can compare the same month year over year to account for natural fluctuations. Sudden drops indicate problems (e.g., competitors, algorithm changes, or technical issues), while steady growth confirms your strategy is working.
Combine multiple filters for deeper insights. Filter by mobile + specific country + last 28 days to see exactly how mobile users in Canada found you recently.
Or filter by desktop + branded queries + compare to last quarter to track brand awareness growth. These combinations answer specific business questions and guide strategic decisions.
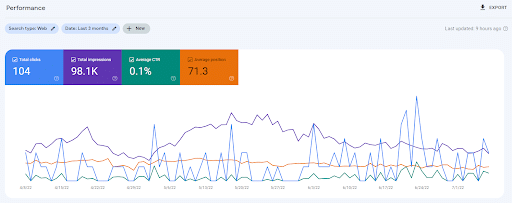
Export filtered data for further analysis. Click the export icon to download your segmented results into Google Sheets or Excel. Create custom reports tracking your most important segments weekly or monthly.
URL Inspection Tool: When & How to Use
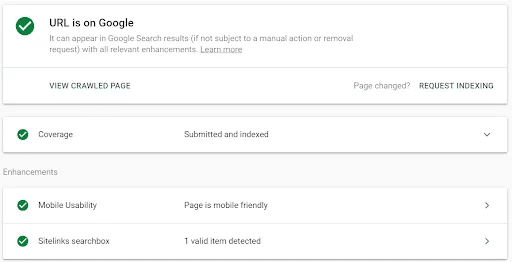
The URL Inspection Tool is your direct line to ask Google about any specific page. It shows exactly how Google sees that URL. It’ll tell you whether it’s indexed, any issues that may be blocking it, and details on mobile usability and structured data.
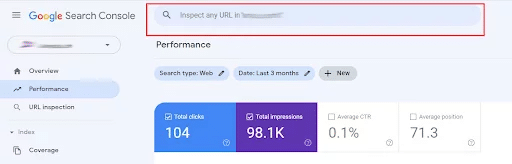
To use it, paste any URL from your website into the search bar at the very top of Google Web Console. Hit enter and wait a few seconds. You’ll see a summary: either “URL is on Google” (indexed successfully) or “URL is not on Google” with an explanation why.
The URL Inspection Tool replaces Fetch as Google, Crawl Errors and Blocked Resources reports that were previously available on the old version of Google Search Console.
The report can:
- Test indexed URLs: Retrieve the version of your page Google has indexed, and report on why or could or could not be indexed.
- Test live URLs: Test if a given URL can be indexed by Google; Google notes that this is useful when checking page updates against the version currently indexed.
- Request a URL be indexed: Request a certain URL be crawled and indexed (or reindexed) by Google; the process can take up to two weeks, and the status can be found in the report.
- View rendered version of a page: Shows how Google views your page.
Common Workflow 1: Request Indexing
When you publish new content or update existing pages, you want Google to notice quickly. After pasting your URL and viewing the results, click “Request Indexing” at the top right. Google adds your page to a priority crawl queue.
This doesn’t guarantee instant indexing, but it significantly speeds things up, often from days to hours. Use this for important updates, new blog posts, or fixed error pages. Don’t spam it with every minor change, as Google limits the number of requests you can make.
Common Workflow 2: Check Mobile Usability
Mobile-friendly pages rank better and provide better experiences. After inspecting a URL, scroll down to the “Mobile Usability” section.
If issues appear, click to see details. Common problems include:
- Text too small to read
- Clickable elements too close together
- Content wider than the screen.
Fix these issues in your theme or page builder, then request indexing again so Google rechecks.
Also, use this tool to debug indexing problems. If a page should be indexed but isn’t, the URL Inspection Tool explains why. You might see “Blocked by robots.txt,” “Excluded by ‘noindex’ tag,” or “Crawled – currently not indexed.”
Each message points you toward the fix. The tool also shows when Google last crawled the page, which helps you determine whether your recent fixes have been indexed yet.
Common Integrations: GA4, GTM, Looker Studio, API
Google Search Console is powerful on its own, but combining it with other tools creates a complete analytics ecosystem. These integrations let you see how search traffic behaves after arriving on your site and automate reporting.
- Google Analytics 4 (GA4) integration connects search discovery with user behavior. In GA4, go to Admin > Property Settings > Search Console Links and connect your GSC property. Once linked, you’ll see Search Console queries in GA4 under Acquisition > Search Console. This reveals what happens after someone clicks through from search: which pages they visit next, how long they stay, and whether they convert. You can create segments for organic search users and compare their behavior to other traffic sources.
- Google Tag Manager (GTM) doesn’t directly integrate with GSC, but it manages the tracking codes that feed GA4 and other tools. Use GTM to deploy your GA4 tags, including conversion and event tracking, without editing your website code. When you combine clean GA4 data (deployed through GTM) with GSC data, you get the whole funnel from search appearance to conversion.
- Looker Studio (formerly Data Studio) turns GSC data into beautiful, shareable dashboards. In Looker Studio, create a new report and add Google Search Console as a data source. Choose your property and select which data to visualize: clicks over time, top queries, CTR by position, etc. Build charts comparing time periods or breaking down performance by device. Share these dashboards with clients or team members who need search performance updates without GSC access.
- Search Console API enables custom integrations and automation for advanced users. Developers can pull GSC data programmatically into custom tools, databases, or reporting systems. This is useful for agencies managing hundreds of properties or businesses building proprietary SEO platforms. The API provides the same data you see in the interface, but in a format that software can read and process automatically.
These integrations eliminate silos between tools. Instead of checking GSC for clicks and GA4 for conversions separately, you see the complete journey. You discover that a specific query drives traffic, but has poor conversion, or that mobile search traffic bounces faster than desktop. These insights guide smarter optimization decisions.
Actionable SEO Workflows Using GSC Data
Let’s turn data into results with five practical workflows you can implement immediately.
Workflow 1: CTR Optimization
- Open your Performance Report and filter for queries where you rank in positions 1-5. Sort by impressions (high to low).
- Look for queries with low CTR compared to their position—position 2 with 3% CTR is underperforming.
- Click into the query to see which pages rank for it. Visit that page and examine the title and meta description in search results.
- Rewrite your title to include the exact query and add power words like “Complete,” “Guide,” or “2025.”
- Update your meta description to directly answer the searcher’s question or promise a benefit.
Within a few weeks, monitor if CTR improves. Even a small increase from 3% to 5% can double your traffic without ranking higher.
Workflow 2: Content Gap Discovery
- Filter your data for queries ranking in positions 8-20.
- Set impressions to at least 100. These queries show clear intent—people want this information—and Google thinks you’re somewhat relevant.
- Export this list and review each query. Ask yourself: do I have content directly answering this question? If not, create it. If yes, is it thorough and up-to-date?
- Expand thin content into comprehensive guides.
Target these “almost ranking” queries with new or improved pages, and you’ll often jump into the top 5 quickly since you’re already in Google’s consideration set.
Workflow 3: Trending Queries
- Use the date comparison feature to compare the last 7 days to the previous 7 days.
- Sort by clicks difference to see queries gaining traction.
- Trending queries reveal changing user interests or seasonal shifts. If a query is surging, create timely content around it or update existing pages while interest is high.
- Check declining queries.
Responding quickly to trends keeps you ahead of slower competitors.
Workflow 4: Index Fix
- Go to the Page Indexing report and click “Why pages aren’t indexed.”
- Review each category: Excluded, Error, Crawled but not indexed.
- Click into “Discovered – currently not indexed” or “Crawled – currently not indexed.” These pages were found but deemed not worthy of indexing.
- Improve content quality, add unique value, fix technical issues, and strengthen internal linking to these pages.
- After improvements, use URL Inspection to request indexing.
- Track how many pages move from “not indexed” to “indexed” over time.
More indexed pages mean more ranking opportunities.
Workflow 5: Mobile Fix
- Open the Mobile Usability report and review flagged issues.
- Click each error to see affected URLs. Common fixes include increasing font sizes, spacing out clickable elements, and ensuring responsive design works correctly.
- Test pages on actual mobile devices to experience what users see.
- Use Chrome DevTools mobile emulator for quick testing.
- After making the fixes, return to GSC and validate them.
As mobile usability improves, your mobile rankings often follow. Since most searches happen on mobile, this directly impacts traffic.
Common Mistakes to Avoid with GSC
Even experienced marketers sometimes misuse Google Search Console. Avoiding these mistakes ensures you’re making decisions based on accurate interpretations.
Let’s talk about some of the most common mistakes made when using Google Console for SEO.
Mistake 1: Misreading Data Time Frames
Google Search Console data is delayed by 2-3 days. If you made changes yesterday and check today, you won’t see results yet. Also, the default view shows the last 3 months, which can hide recent trends.
Always check your date range and allow sufficient time before evaluating the impact of changes. Use comparison views to see before-and-after snapshots rather than hoping for instant results.
Mistake 2: Ignoring Mobile Performance
With mobile-first indexing, Google primarily uses your mobile site for ranking. Yet many people only check overall performance without filtering by device.
Always segment your data by mobile to ensure your most important version performs well. If mobile clicks lag significantly behind desktop, you have a mobile problem. Fix it immediately, as it’s costing you traffic.
Mistake 3: Focusing Only on Branded Queries
If most of your traffic comes from people searching your brand name, that’s great for brand awareness but terrible for growth.
Filter out branded queries to see how you perform for actual topics and products. Non-branded queries represent new audience discovery. If non-branded traffic is minimal, you need better content targeting industry terms and customer questions.
Mistake 4: Not Fixing Validation Errors
When you fix coverage issues but forget to click “Validate Fix,” Google won’t recheck those pages. They’ll eventually recrawl naturally, but validation accelerates the process.
After fixing errors, always validate so Google confirms your fixes worked. Track validation status to ensure problems are truly resolved.
Mistake 5: Treating Position as Absolute
Average position is exactly that – an average. Your page might rank at position 1 for one query variation and at position 15 for another. Position also fluctuates based on personalization, location, and time.
Don’t obsess over small position changes like moving from 3.2 to 3.4. Focus instead on traffic trends and CTR, which directly impact your business.
Mistake 6: Ignoring Manual Actions and Security Issues
If you receive a manual action penalty or security warning, a message appears in GSC. Some users never check these critical notifications. Always review the Security & Manual Actions section, especially if traffic suddenly drops. Manual actions can devastate rankings until you fix the issue and request reconsideration.
Mistake 7: Not Using Filters and Segments
Looking only at aggregate data hides important insights. Someone might say “my traffic is flat,” but filtering by device shows mobile up 20% and desktop down 20%. Or filtering by country reveals growth in Canada but a decline in the US.
Always segment data by device, country, and query type to understand what’s really happening.
Google Search Console Glossary
Understanding Google Search Console means understanding the metrics and KPIs it tracks. Here is a glossary of the most commonly used terms and their definitions to help you understand the platform.
| Metric | Definition |
| Clicks | The number of times users clicked your link in search results to visit your site |
| Impressions | How many times your URL appeared in search results, regardless of whether it was clicked or not |
| CTR (Click-Through Rate) | The percentage of impressions that resulted in clicks. Calculated as (Clicks ÷ Impressions) x 100 |
| Position | The average ranking position of your URL in search results for a query |
| Query | The exact words or phrases a user typed into Google search before seeing your result |
| Page | The specific URL from your website that appeared in search results. |
| Country | The geographical location of the user performing the search |
| Device | The type of device used for the search: desktop, mobile, or tablet |
| Search Appearance | Special result types your page appeared in like rich results, AMP, or featured snippets |
| Crawl Stats | Data about how Googlebot crawls your site, including requests per day or time spent downloading pages |
| Indexed Pages | URLs that Google successfully crawled, processed, and added to its search index |
| Coverage Errors | Issues preventing Google from indexing your pages, like server errors or blocked resources |
| Excluded Pages | Pages Google chose not to index for reasons like duplicate content, nonindex tags, or canonicalization |
| Valid Pages | Pages successfully indexed without errors or warnings |
| LCP (Largest Contentful Paint) | How long it takes for the largest visible content element to load |
| FID (First Input Delay) | How long it takes for a page to respond to the first user interaction |
| INP (Interaction to Next Paint) | A newer metric replacing FID that measures responsiveness throughout the entire page visit |
| CLS (Cumulative Layout Shift) | How much visible content shifts unexpectedly during loading |
| Mobile Usability | Whether your page works well on mobile devices, checking for issues like small text or touch elements that are too close |
| Manual Action | A penalty applied by Google’s human reviewers when your site violates search quality guidelines |
| Security Issue | Problems like malware or hacked content that Google has detected on your site |
| Sitemaps | XML files listing your site’s URLs, helping Google discover and crawl your content efficiently |
| Internal Links | Links from one page of your site to another page on the same site |
| External Links | Links from other websites pointing to pages on your site (also called backlinks) |
| Referring Domain | A website that has at least one link pointing to your site |
| Anchor Text | The visible, clickable text in a hyper link, which provides context about the linked page’s content |
FAQs About How to Use Google Search Console to Improve SEO
1. How do I verify my site in Search Console?
Click “Add property” in your Google Search Console dashboard, then choose between Domain or URL Prefix verification. For Domain properties, add the provided TXT record to your domain’s DNS settings through your hosting provider. For URL Prefix properties, choose from the following methods: upload an HTML file to your website, add an HTML meta tag to your homepage, connect via Google Analytics, use Google Tag Manager, or verify via your domain provider. After completing your chosen method, click “Verify” in GSC. Verification typically happens within minutes, but DNS changes can take up to 48 hours.
2. What are the key GSC performance metrics?
The four essential performance metrics are Clicks (how many people clicked your link in search), Impressions (how often your page appeared in search results), CTR (click-through rate; the percentage of impressions that resulted in clicks), and Position (your average ranking position in search results). Together, these metrics show both visibility and effectiveness. High impressions with low clicks suggest your titles need improvement, while a good position with few impressions means you’re ranking for the wrong queries.
3. How do I submit a sitemap in GSC?
Navigate to “Sitemaps” in the left sidebar of Google Search Console. Enter your sitemap URL in the text field (typically yourdomain.com/sitemap.xml or yourdomain.com/sitemap_index.xml). Click “Submit” and wait for Google to process it. Most website platforms and SEO plugins automatically generate sitemaps—check your site root directory or plugin settings to find yours. After submission, GSC shows the number of URLs discovered and any errors encountered. Resubmit your sitemap whenever you make significant site changes or add substantial new content.
4. How do I fix mobile usability issues in GSC?
Open the “Mobile Usability” report under the “Experience” section in your left menu. Review any errors like “Text too small to read,” “Clickable elements too close together,” or “Content wider than screen.” Click each error to see affected URLs. Common fixes include increasing font sizes to at least 16px, adding proper spacing between buttons and links, ensuring your site uses responsive design, and removing horizontal scrolling. Make changes in your website theme, page builder, or CSS. After fixing issues, return to GSC and click “Validate Fix.” Google will retest your pages and confirm when issues are resolved, which typically takes a few days to weeks.
Master Your Google Search Console Insights & Improve Your SEO with Ignite Visibility
Whether you’re a small business looking to drive local traffic or a large franchise with hundreds of locations, Ignite Visibility is here to help.
We’ve improved the visibility of hundreds of businesses, including stand-alone shops, multi-location businesses, and national franchises. Whether you’re in healthcare, financial services, fast-food franchises, or anything in between, our experts can help you embrace your Google Search Console insights and improve your ranking and visibility.
Ignite Visibility can help you:
- Set up your Google Search Console correctly
- Understand and analyze data
- Make data-driven content decisions
- And more!
Are you ready to get started? Schedule a free demo today!