Come 2021, CLS will be an official ranking factor and Google will start docking URLs with poor scores, as shifty layouts indicate a poor user experience.
You’ll want to learn how to monitor this metric and fix potential problems now to avoid losing your position and incoming traffic when there’s more at stake.
Below, I’ll explain what CLS is and what you need to know about this new “vital” sign.
What We’ll Cover:
- What is cumulative layout shift?
- Why it happens
- How Google calculates CLS
- Where you can track CLS performance
- How to improve a poor CLS score
- Ways to prevent further issues
What is Cumulative Layout Shift (CLS)?
As mentioned, Cumulative Layout Shift (CLS) is a Core Web Vitals metric that measures visual stability.
Even if you’re unfamiliar with the term, you’ve probably experienced CLS countless times.
One typical example happens when users are reading an article and an entire block of text disappears.
In other cases, users might try to click a link and all of a sudden, the link moves and you click something you didn’t want to click.
I’ve had this happen multiple times with online banking — the login button shifts and I end up on the “forgot my password” page.
While that example is a minor source of friction, if the same thing happened while making a transfer, it could turn into a bigger problem.
The main problem with CLS is it often goes unnoticed because unexpected shifts often don’t show up on the developer side but may be causing trouble for users.
In other words, CLS aims to tip you off to any unexpected shifts users experience out in the wild.
This metric allows you to measure how often users experience shifting page elements.
Reporting tools like PageSpeeds Insights and a new Google Search Console report pinpoint specific problems and recommend solutions.
Why Does Cumulative Layout Shift Happen?
Developers have something of a home-court disadvantage here.
What you often see happen is, many of the assets needed to render a page are loaded onto the browser’s cache.
On the developer/SEO side, elements load fast, without any indication that something isn’t right.
The problem is, third-party content often doesn’t behave the same way in the development setting as it might in the field.
Meaning, developers can easily miss CLS or other load-time delays, passing that sub-par experience on to their users.
According to Google, CLS is typically caused by one or more of the following problems.
- Images without dimensions
- Embeds, ads, or iframes without dimensions
- Web fonts causing FOIT/FOUT
- Dynamically injected content
- Actions waiting on a network response before updating DOM
How Does Google Calculate Cumulative Layout Shift?
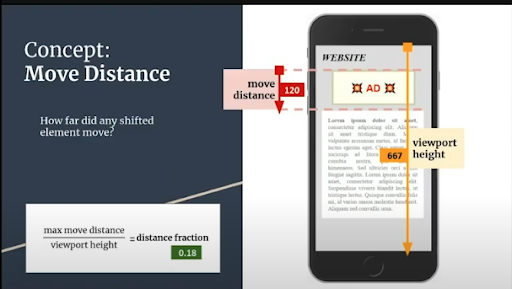
Google calculates for the impact fraction and the distance fraction for each unexpected shift happening on the page.
Your score represents the sum total of every out-of-place element on the page and looks at how much each shift impacts the viewport, as well as how far elements moved during page loads.
As the impact and distance fractions grow, the CLS score gets worse.
Note: you don’t need to worry about performing calculations on your own.
This just makes it easier to understand what your users are experiencing when visible elements are unstable.
Where Can You Track CLS Performance?
As part of the Web Vitals initiative, Google has standardized performance metrics and incorporated the Core Vitals into all of its reporting tools.
What this means is, you can check Cumulative Layout Shift within several different dashboards.
That said, they’re not interchangeable. Different tools serve different purposes.
Field tools measure performance from the perspective of your actual users, whereas lab tools are designed to help developers catch problems before pages go live.
Within those two designations, you’ll find that some tools track macro-level CLS data, while others get real granular.
Here’s a quick rundown of some of those tools and how you might use them (for more options, here’s a post that breaks down the best PageSpeed tools available).
Chrome User Experience Report (CrUX)
This report provides real, anonymized user experience data organized by country.
To get insights relevant to your website and its users, you’ll need to incorporate the CrUX API (I should mention, this does require a bit of coding know-how).
The data displayed in the CrUX report gives users a quick way to size up website performance by region, device, demographic group, or whatever custom metrics that matter to you. CrUX is not designed for identifying or fixing specific issues.
You might use this report to gauge what percentage of your users experience unwanted shifts, then determine if these problems are more common on a particular device or in a certain location.
This way, you’ll have a pretty good idea of where to start digging in.
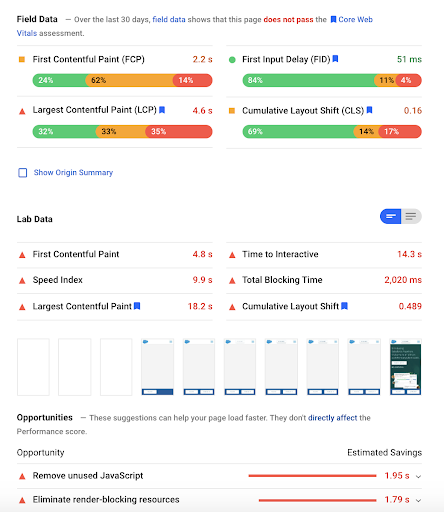
PageSpeed Insights
The PageSpeed Insights report allows you to track performance metrics from the lab and in the field and receive a detailed list of opportunities and diagnostics, with actionable tips for improving.
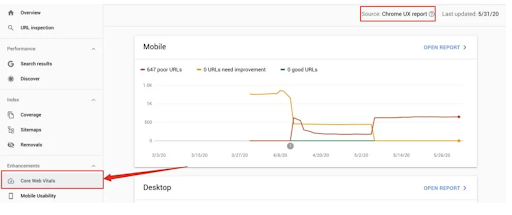
Google Search Console (Core Web Vitals report)
Chrome DevTools
Chrome DevTools is a set of developer tools that are built into the Chrome browser. The idea is, developers can edit page on demand, diagnose and fix problems fast, and optimize results on the fly.
You can use DevTools to debug JavaScript, inspect animations, and audit your site. Additionally, this tool allows users to optimize page speed. While this tool is a bit more complex than Google PageSpeed Insights, it provides an all-in-one convenience.
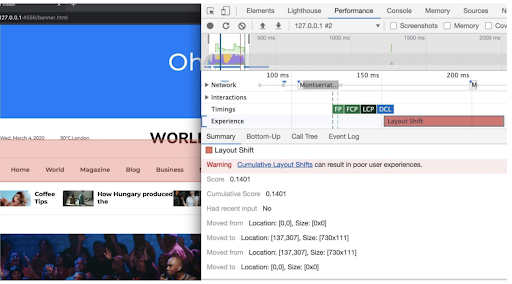
For example, the performance panel tracks opportunities and diagnostics (ala PSI) but also allows users to fix issues from the same dashboard.
As you can see, this report shows the CLS score, along with an overlay that highlights areas causing trouble.
Lighthouse
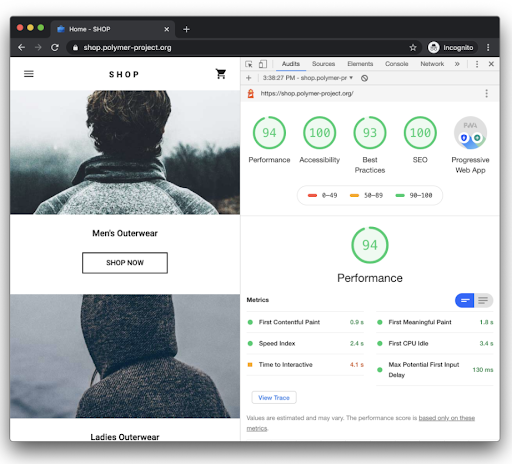
Lighthouse is an open-source tool that allows users to run website audits on SEO, performance, and accessibility. Here, you’ll find a lot of the same metrics and recommendations that you’ll find in PSI, though Lighthouse is a lab tool, built for testing.
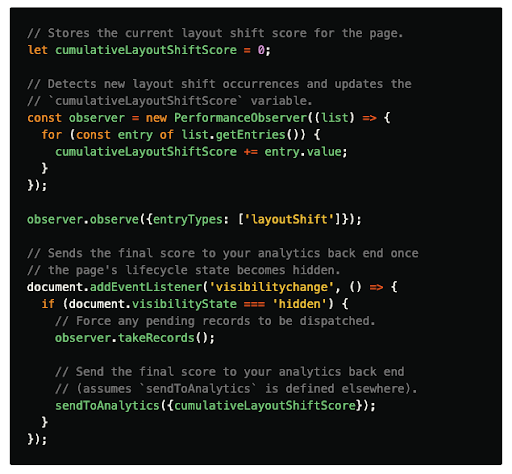
Measure CLS in JavaScript
According to the web.dev site, the simplest way to measure CLS (as well as the other Web Vitals field metrics) is by using the web-vitals JavaScript library.
How Do You Improve a Poor CLS Score?
Honestly, much of optimizing for CLS involves making sure there’s enough space available for ads, text blocks, and other on-site elements.
When Ads Are to Blame for CLS
Ads are one of the main culprits when it comes to on-page layout shifts.
The reason is, publishers and ad networks often support dynamic ad creative, which often causes visible content to be pushed down the page.
Google recommends statically reserving space for ads by styling the element before the ad tag library loads.
This allows you to set a specific height and width, ensuring that ads will be constrained to those dimensions.
Dynamically Injected Content
You’ll want to avoid inserting content above existing web elements, as it may cause layout shifts. Dynamically inserted content refers to CLS issues that happen with banners or forms while loading a site. In some instances, users might not be able to “x” out of a pop-up.
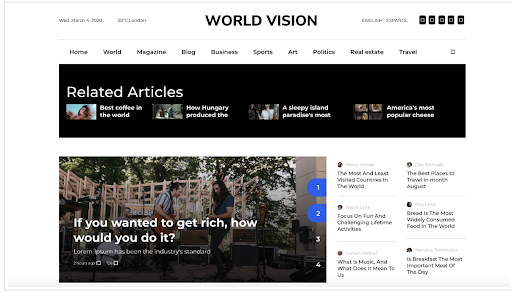
In others, on-page elements may be usable but rearranged, as you’ll notice in these examples below.
Web-Based Fonts
Downloaded web fonts can cause a couple of issues that may have a negative impact on CLS: Flash of Invisible Text (FOIT) and Flash of Unstyled Text (FOUT).
Chrome 83 includes font loading improvements that eliminate layout shifts associated with FOIT when pre-loading optional fonts. According to Google, adding <link rel=”preload”> with font-display: optional to your site’s backend should do the trick.
Additionally, the Font Loading API can be used to reduce the amount of time it takes to get the desired fonts.
Preventing CLS Issues
To avoid any potential “shifts,” you’ll need to declare height and width dimensions for images and videos in your site’s HTML code.
If the images in question are responsive, you’ll need to indicate the dimensions for each viewport, making sure both versions use the same aspect ratio.
Per Google, you can calculate aspect ratios with this aptly-named tool, AspectRatioCalculator.com.
You can also reserve the appropriate amount of space for media elements using a tool like CSS aspect ratio boxes. This tool tells the browser to “reserve” the right amount of space within the document, while the image loads.
Alternatively, you can also use the unsized-media feature policy to enforce “appropriate behavior” in browsers offering support for feature policies.
Make sure you avoid inserting content above existing content, unless you’re responding to a user’s comment or question. Adding additional text to the site’s backend can easily cause unexpected (and undetected) layout shifts to occur.
Finally, you’ll also want to limit the use of animations. Stick to those that create continuity during transitions or enhance the experience, while avoiding those that trigger unwanted page element shifts.
Wrapping Up
Cumulative Layout Shift is an important metric for a pretty straightforward reason: shifting website elements create a bad experience.
Again, much of the optimization process is about deliberately creating borders for ads, banners, and images, that may otherwise slide away from their intended position.
You’ll also want to pre-load web fonts, use CSS transform animations, and avoid pasting content above existing elements.

