


Expert Digital Marketing Services
![]()

Earned Media


Email Marketing
Email Marketing

Amazon Marketing

More Services
More Services
We offer a wide range of custom
services uniquely tailored to
each business.
Learn More

ROI-BASED MARKETING
Bring certainty into your marketing mix
![]()
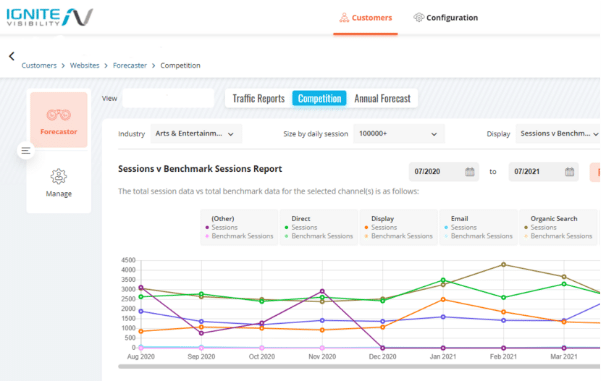
Meet Certainty, Ignite Visibility’s proprietary digital marketing forecasting system. Our clients have the upper hand with the power of our Certainty software.
We grow businesses online by evaluating competitive data, forecasting revenue, installing reliable tracking, and offering best-in-class strategy, services, reporting, and industry insights.
Best-in-Class Results
![]()


+22,707%
Increase in organic impressions through
a targeted social media campaign

AWARDS
![]()
![]()
1 SEO company
in the USA
- Clutch
![]()
5x Inc. 5,000 company
- INC
![]()
1 Paid Media company in the USA
- The Manifest
![]()
Best Places To Work
- San Diego Business Journal
![]()
Best Places To Work
- San Diego Business Journal
![]()
1 Paid Media company in the USA
- The Manifest
We deliver success.
What will yours look like?
![]()
See How Ignite Visibility Helps You Hit Your Business Goals
![]()
Say goodbye to guesswork. Get your free forecast to see real revenue reporting and forecasting right away. You’ll see the number-driven roadmaps and custom reports you need to feel confident in your ROI.