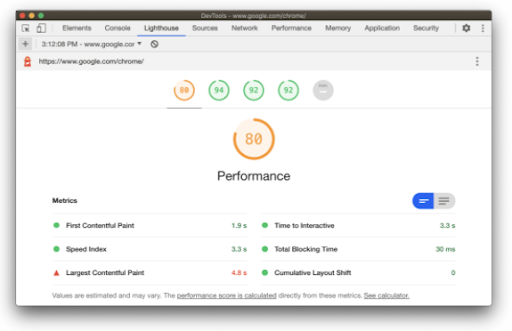
It’s long been a challenge for web developers and SEOs to measure how quickly the most important on-page elements become visible to users.
Largest Contentful Paint (LCP) aims to address this by measuring load times for most important on-page elements.
Below, I’ll explain what LCP is, how to track your performance and how to resolve LCP issues.
What We’ll Cover:
- What is largest contentful paint?
- What causes low LCP scores and how to check them
- How to fix largest contentful paint issues
- Ways to optimize your LCP with Web Vitals Tools
What is Largest Contentful Paint?
Largest Contentful Paint (LCP) is one of Google’s Core Web Vitals, used to measure page loading performance based on perceived loading speed.
More specifically, LCP is used to measure how long it takes to render the elements that are most important to your user, which is typically the largest image or block of text visible within the viewport.
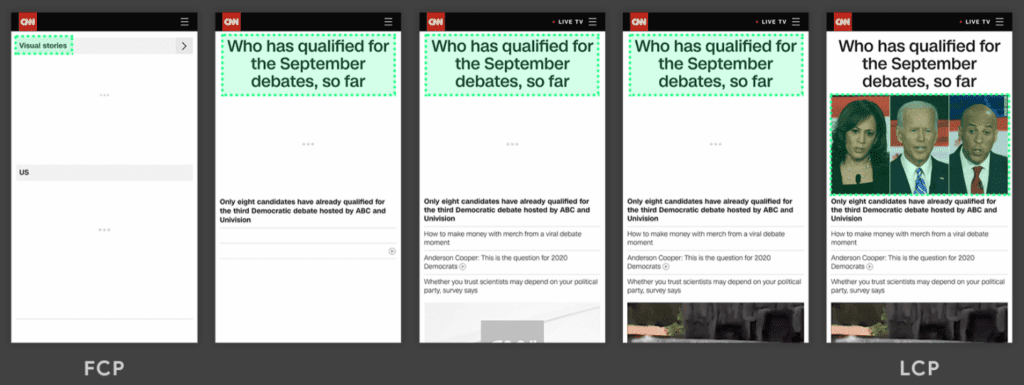
LCP does not measure the complete load speed of a page or the first element that loads (that’s covered by another metric, First Contentful Paint, or FCP, which isn’t one of the core vitals).
Notice how on the far left, the FCP is a tiny element in the left-hand corner that doesn’t tell users anything about what’s on the page.
By contrast, the image on the right covers the entire frame. Upon arrival, visitors are presented with exactly what was promised pre-click.
By measuring the time it takes to provide the “meat” of a page to readers, website owners get a clearer picture of how performance impacts the user experience.
According to Google, sites should aim to fill the first “frame” of content (main content above the fold) within 2.5 seconds to provide a good user experience.
The idea is, a fast LCP will help you convince users to stay on your website, and
prevent bounces by displaying information upon arrival.
Measuring LCP gives SEOs a quick way to find out whether visitors are greeted with a blank page or a complete piece of content.
How to Check Which Element Triggers Largest Contentful Paint
According to Google Developers LCP looks at the following elements.
- Image Elements
- Image Tags Within SVG Code
- Background Images with CSS
- Text Block-Level Elements—Think paragraphs, headings, or lists.
- Thumbnails for On-Page Video Elements
Do note that while LCP will soon become a ranking signal, Google still looks at dwell time, conversions, and other factors to determine SERP position.
What Causes a Poor LCP Score?
Per Google’s Web Dev site, there are four main reasons that your LCP scores might not be as fast as you would like.
- Slow Server Response Times.
- Render-Blocking CSS and JavaScript
- Client-Side Rendering
- Resource Load Times
How to Fix LCP Issues
Route users to a nearby CDN. Another way to improve LCP is by routing users to a nearby content delivery network, or CDN. A CDN is a network of servers that store a cached version of your content across multiple locations to minimize the distance between visitors and your website’s server.
If the content on your website runs on a single server, users based in far-off locales will experience slow load times because their browser requests must travel around the world and back.
Local businesses won’t get much out of a CDN, however, websites with national or international traffic can enhance user experience and reduce bandwidth.
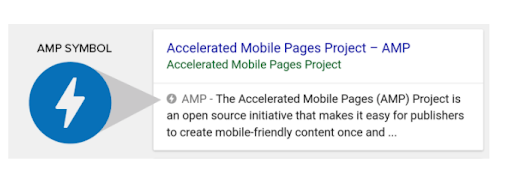
Consider Using AMP. AMP, or Accelerated Mobile Pages, is a stripped-down version of your webpage written in HTML that eliminates animation and other website elements to increase load times.
AMP pages are stored on Google’s own server cache, which means that pages load in about one second. As a point of reference, non-AMP pages take between 7-10 seconds, on average, to load.
Render Blocking JavaScript and CSS
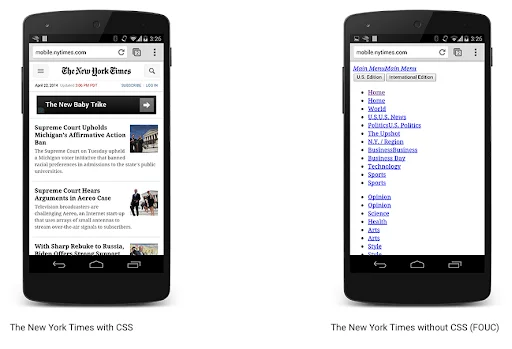
Minify CSS. CSS files often contain comments, indentation, or white spaces, which make the code more legible for developers.
On the browser side, these characters are completely unnecessary and minifying these files will free up some space by removing them.
Regardless of what’s dragging your LCP score down, reducing the amount of blocking CSS will always improve load times.
Use Next-Gen Image Formats
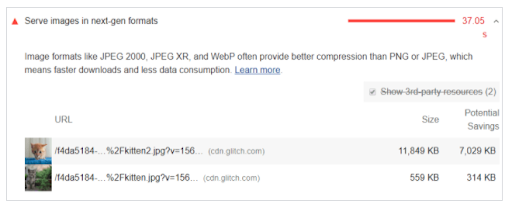
According to the web.dev site, JPEG 2000, JPEG XR, and WebP offer better compression and higher quality than JPEG or PNG.
By encoding your images in a WebP format, you can reduce load times and data use for your users.
How to Optimize LCP with Web Vitals Tools
LCP can be measured in the lab or in the field using a handful of tools.
Lab tools are best suited for understanding how a webpage might perform before it goes live. These tools are more for testing layout than identifying potential user experience issues.
Field tools, on the other hand, are used to measure how real-world users perceive your website.
That said, each tool measures LCP (and the other vitals) using a different set of metrics, allowing you to get a clear picture of your on-page performance from the user side, as well as Google’s.
Below, I’ll go over how you might use each one to solve LCP issues.
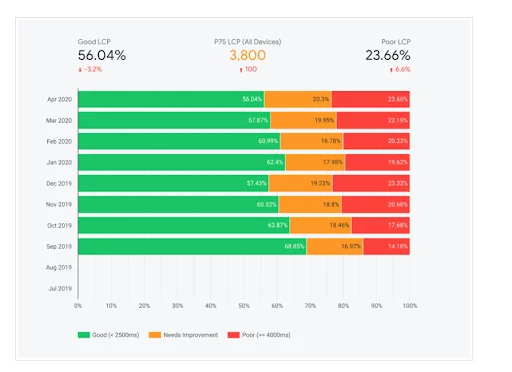
Chrome UX Report (CrUX)
The Chrome UX Report (CrUX) provides public data on real users’ experience across millions of popular websites.
This data is used as part of Google’s BigQuery ML project, which aggregates UX metrics by region. Each data set represents a single country and aims to measure the user experience by region based on a handful of key dimensions.
While that might not seem relevant to LCP and other performance metrics, the database comes with an open API that allows developers to retrieve performance data for any website.
That means, if you know how to do some basic coding, you can track LCP for your own site or your competitors.
This report provides a zoomed-out view of the customer experience by demographic, device, and location.
For example, you might learn that iPhone users experience faster load times or that certain countries wait longer for content to appear.
My recommendation is that you use this report as a tool for scanning your page performance metrics on a macro level, then using that information to pinpoint key issues.
Google Search Console
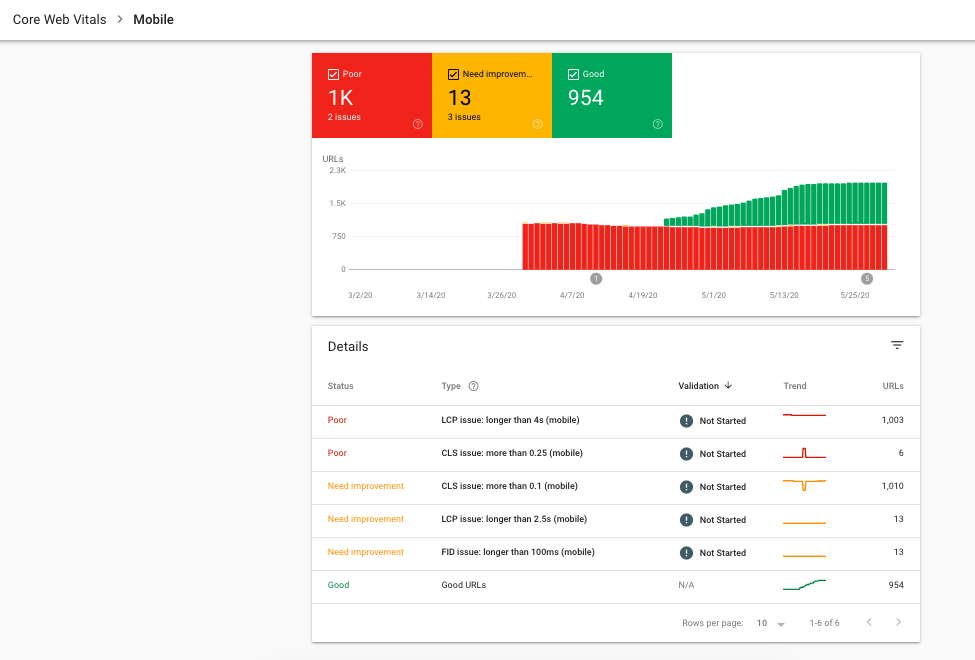
You can check Largest Contentful Paint, as well as the other vitals by opening the “Core Web Vitals” report in your GSC account. The Search Console report allows you to track field performance metrics at the page level.
This report is best used for identifying specific pages that need attention.
Pages are grouped according to problem type, making it easy to find and fix problems.
PageSpeed Insights
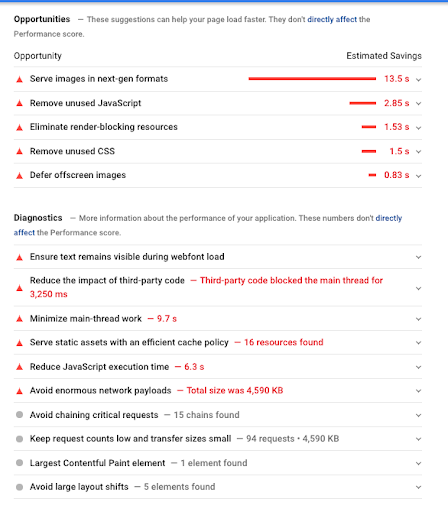
You can also use PageSpeed Insights to analyze your LCP performance at the aggregate level and origin level. Where GSC reports on a per-page basis, PSI looks at your site on the whole.
What’s nice about this report is, it breaks down opportunities and diagnostics one-by-one.
While the example I’ve entered below highlights several issues, it’s broken into an accessible checklist.
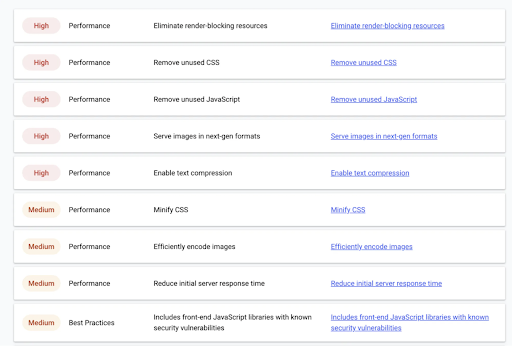
Another option for auditing performance metrics is through the web.dev/measure report. Here, you’ll receive a list of elements arranged by priority level.
Again, this gives users a step-by-step list of elements that could be slowing down load times.
The data found in this report is the same as what you’ll find in the PSI report, though in this case, you can measure performance over time.
Lighthouse
Lighthouse is an automated tool for running website audits.
Like PageSpeed Insights, Lighthouse diagnoses issues and highlights opportunities to improve your site’s UX, the key difference being, Lighthouse is a lab tool.
Lighthouse breaks its findings into three categories:
- Points out opportunities to improve page performance. All suggestions provide an estimation of how changes might impact performance.
- Diagnostics give users more insight into how well pages adhere to Google’s web development best practices.
- Passed Audits. Provides a running tally of how many audits your site has passed.
Lighthouse is designed to help users optimize Core Web Vitals before going live. Once you’ve published your content, you can compare Lighthouse data with field LCP performance.
Easy Ways to Improve Largest Contentful Paint Score
Start with Anything Labeled “Poor”
Google recommends fixing anything with the “poor” label first, as these are the biggest issues impacting your LCP score.
Once you’ve resolved those critical issues, you can then decide to tackle fixes by priority or your most important URLs.
Keep in mind, those URLs with a “needs improvement” label could be improved, but aren’t as urgent as your “poor” URLs.
Reduce Page Size
According to Google, a page and its resources should be 500KB or less.
They recommend limiting the number of page resources to 50 or less for optimal performance.
You might want to consider using AMP to resolve this issue, as the bare-bones format promises fast load times.
However, if a page needs CSS elements, animations, ads, and other “extras,” this format might not be a great choice.
Articles, recipes, and product pages work well with AMP, and switching to the high-speed format could give you a performance boost.
Resolve Issues & Validate Fix
Once you’ve made your changes to your site, go back to the PageSpeed Insights tool to see if anything improves.
Continue this process until you’ve hit that target LCP score.
Next, you’ll head over to your GSC account and click “validate fix” to tell Google that you’ve updated your site.
Conclusion
Largest contentful paint (LCP) is an effective metric for tracking whether visitors see the most important content in their viewport upon arrival.
LCP’s role in the big-picture strategy is ensuring that visitors see and understand your message immediately.
It’s the first step in convincing users to take the next step and learn more about what you’re all about.
When evaluating user experience, or even just page load performance, no one metric paints a full picture. LCP and the other Core Web Vitals could change the Google experience much like EAT guidelines and intent-based search have changed content marketing and SEO.
Together these metrics take us one step closer to understanding UX, making it possible to optimize for ALL factors that make or break an experience.

