These are some of the best pagespeed tools online for 2020!
Go through this list, use these tools, and your site will be so fast it shocks users.

What We’ll Cover:
- PageSpeed Insights
- Pingdom
- GTmetrix
- WebPageTest
- KeyCDN
- Uptrends
- dotcom-monitor
- Yellow Lab Tools
- Sucuri Load Time Tester
- Google Mobile Scorecard
- Google Analytics Site Speed Report
- AMP Validator
- WordPress Pagespeed Tools
- Drupal and Magento Pagespeed tools
Page speed is a big deal.
Not only does it matter to users trying to visit your site, but Google takes the speed of your site into consideration when determining where it will rank in its SERPs. According to Think with Google, as page load time goes from just one to 10 seconds, the bounce rate probability increases by a staggering 123%. The search engine takes this conversion data heavily into account in their algorithm.

Fortunately, there are plenty of tools designed to help your site load as fast as possible. Best of all, though: most of them are free.
It’s also a great idea to use more than one tool. That way, you can get a second opinion about how quickly your website loads.
In this article, we’ll go over some of the best pagespeed tools that are available online.
Pagespeed Tools – PageSpeed Insights
PageSpeed Insights gets the top spot for a very good reason: it’s owned and operated by Google.
It’s safe to say you want the company that runs the most popular search engine on the planet to give you some insight as to how quickly your page loads.
That’s especially true because Google uses page speed as part of its Core Web Vitals.
PageSpeed Insights couldn’t be easier to use. You just plug in a URL, hit the big, blue “ANALYZE” button on the right, and wait a few seconds for the report.
The resulting report consists of two parts: a mobile report and a desktop report. They each have their own tab.
By default, PageSpeed Insights displays the mobile report. That’s because mobile is everything.
Each report will show important metrics such as:
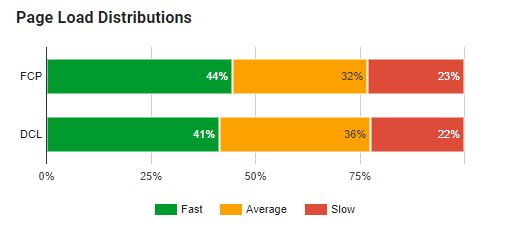
- First Contentful Paint – measures when the browser loads the first bytes of the page. You’ll often see it abbreviated as FCP.
- First Meaningful Paint – how long it takes the meaningful content of the page to appear on the screen. You’ll often see it abbreviated as FMP.
- Speed Index – tells you how quickly the elements on a page are visibly populated. The lower the score, the better.
- First CPU Idle – formerly First Interactive. It tells you when the page is minimally interactive.
- Time to Interactive – this tells you when the page is ready for user input. Event handlers are registered for most of the visible page elements and the page responds to user interactions in 50 milliseconds or less.
- Max Potential First Input Delay – measures the time from when a user first interacts with the page to the time when the website responds to that input. An interaction occurs when a visitor clicks a link, presses a button, or uses any widget on the screen.
You’ll also see an overall score that ranges from 0 – 100, with 100 being the best. You should consider anything below 50 a slow page that requires your attention.
Additionally, Google gives you a score based on field data. That’s the average load time of people who’ve visited that page in the past.
In other words, you get real-world data in addition to Google’s “lab” data.
Sometimes the real-world data varies significantly from the lab data. If you see that in your report, you should probably give precedence to real-world data. That is, after all, what real users are seeing on your page.
If you’ve pimped your site with all kinds of technological bells and whistles, you might find that your load time suffers as a result. Your Optimization score will reflect that.
Don’t be too discouraged if you get a yellow score on the Mobile report. That’s because your WordPress theme is probably using render-blocking JavaScript and CSS. It’s very difficult to fix that problem (and probably not worth the effort).
PageSpeed Insights is a page speed test tool that will tell you exactly why it’s issued deductions on your Optimization score. You can scroll down the page and look under the “Optimization Suggestions” section to see where your page needs improvement.
Bookmark PageSpeed Insights. It’s the Google pagespeed tool and it’s your new best friend when it comes to checking how quickly your website loads.
Pagespeed Tools – Pingdom
Next to PageSpeed Insights, Pingdom might be the best pagespeed tool.
Again, it’s free. But you might have to wait in a queue before you get your results.
As with PageSpeed Insights, you just paste in a URL and click the green “START TEST” button. After a few seconds, you’ll get your report.
Unlike PageSpeed Insights, though, you have to select a testing server location. Be sure to choose the one that’s closest to people in your target market and not closest to where you’re at.
For example, if you’re in New York City, you might be tempted to select the server from New York City. But if you’re marketing to people in Sweden, you should select the server in Stockholm to get a more relevant report.
Pingdom will give you a performance grade on a scale of 1-100. It will also show you the website’s page speed online and page size.
The tool will also display the percentage of pages that are slower than yours. That will give you an idea about how fast your page is compared to other pages.
Pingdom will also show you performance insights. That section will include suggestions about how to improve your pagespeed.
Finally, Pingdom will tell you how long it takes to load each of your resources. That will give you more ideas about your page speed online.
GTmetrix Pagespeed Tool
Another great example of website speed tools to add to your arsenal is GTmetrix.
That’s because it gives you insights from two different sources. So you get a second opinion with one tool.
When you run a report with GTmetrix, you’ll get a PageSpeed score and a YSlow score. You might find that they’re significantly different.
That’s okay. They use different metrics to gauge pagespeed.
Fortunately, GTmetrix will show you exactly why each source issued deductions on your overall score. You can use those insights to improve performance.
GTmetrix will also show you how long it takes your page to load, the total size of the page in bytes, and the number of requests that it took to load the page entirely.
WebPageTest Pagespeed Tool
Somebody was smart enough to register the domain name “webpagetest.org” and use it to make a great pagespeed test tool available to the public free of charge.
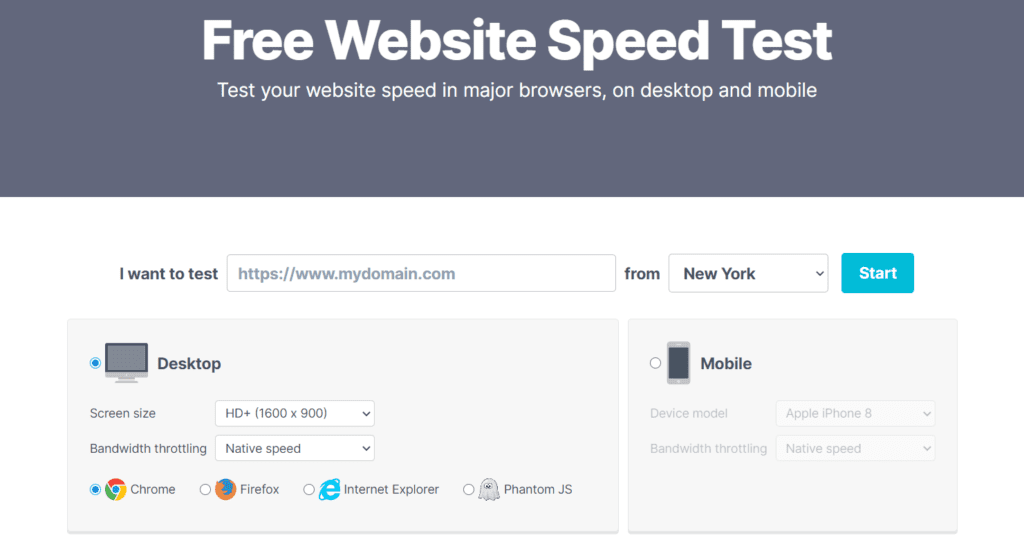
Like other website speed tools, WebPageTest requires you to select the location of the test server. Be sure to pick one that’s close to your target market.
You also have the opportunity to select the browser you want to use in your test. That can come in handy if you find that the vast majority of your visitors are using a specific browser.
There are also advanced settings. For example, you can set the connection speed in your test. Select the 3G option to test how long it takes your page to load for mobile users with slow connections on a data network.
The report gives you a series of letter grades instead of numbers. The grades are A – F.
You’ll receive a different grade for each of the following tests:
- First Byte Time (this is the most important metric that Google takes into account)
- Keep-alive Enabled
- Compress Transfer
- Compress Images
- Cache static content
- Effective use of CDN
Note that if you’re not using a content delivery network (CDN), you’ll probably see a big “X” for that grade. That just means it doesn’t apply.
The tool will also show you your overall load time, page size in bytes, and the number of requests needed to load the page.
Finally, WebPageTest also shows you plenty of graphs and images to give you a better understanding of what impacts your pagespeed.
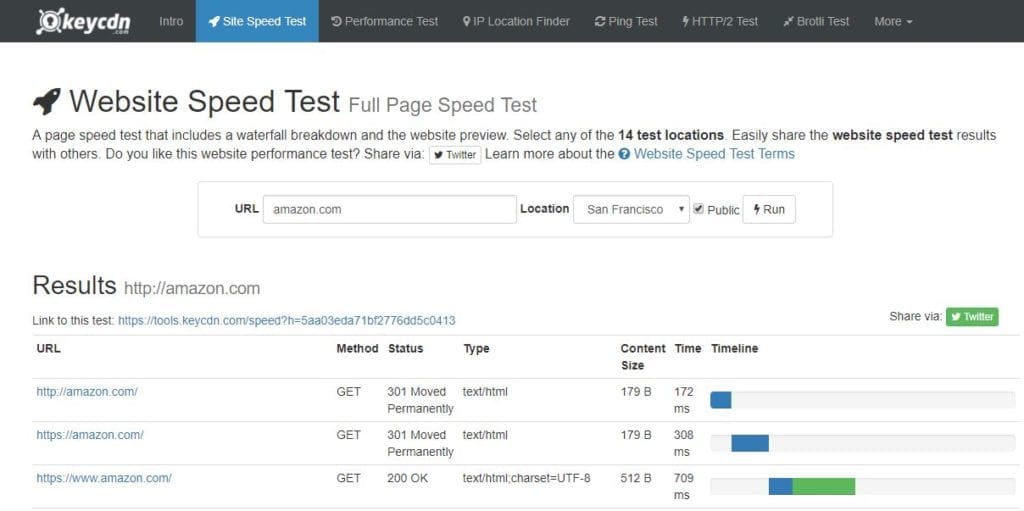
KeyCDN Website Speed Test
Although it doesn’t offer the exhaustive analysis that some of the other pagespeed tools provide, the KeyCDN Website Speed Test is a nifty little utility.
Just plug in your URL, select your test location, and click the “Run” button to check your pagespeed online.
After a few seconds, the tool will show you how long it takes to load your page. It will also display load times for each of your resources (JavaScript libraries, external CSS files, etc.).
Finally, it will show you an image of your web page at the bottom.
Uptrends Pagespeed Tool
Uptrends doesn’t offer a whole lot of detail beyond a waterfall diagram, but it does give you more than 35 locations to choose from in your test.
It’s a great tool to check if you’re operating in a global space. That way, you can be sure your site loads quickly for people all around the world.
You can also use it to find resources that might be bottlenecks.
Pagespeed Tools – dotcom-monitor
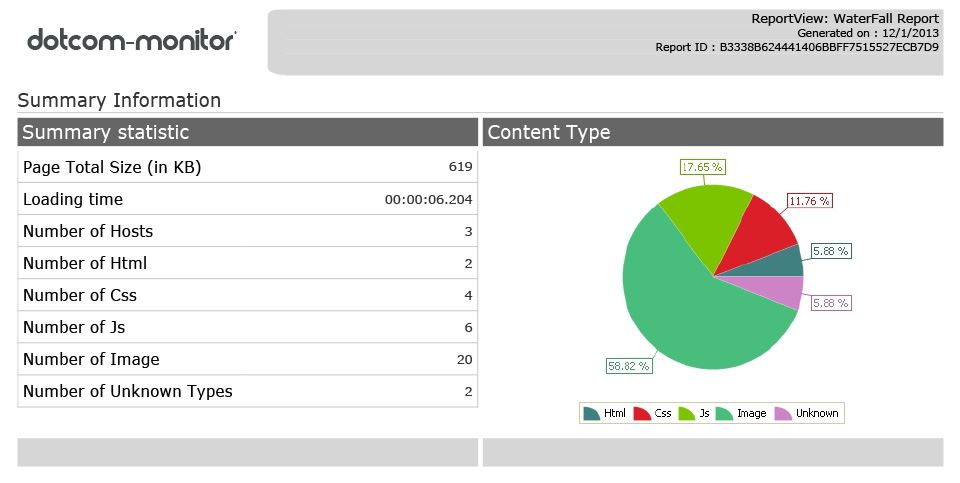
Don’t let the simple name fool you: dotcom-monitor is a great tool to test your pagespeed.
Why? Because it offers tests for 25 locations worldwide.
It’s different than other tools in that it automatically tests your page for all of those locations. You don’t have to choose one.
Use the tool to compare how quickly your page loads for people in London with how quickly it loads for people in San Francisco. You can also check load times in Dallas, Amsterdam, Tel Aviv, and other locations.
Even better: dotcom-monitor does a first visit and a repeat visit in its tests. It checks your page twice.
Why is that important? Because you might be using some kind of server-side caching that will load the page more quickly on the second pass. That’s why second page loads are often quicker than first page loads.
Also, dotcom-monitor allows you to select a browser to use in your test.
Yellow Lab Tools
Yellow Lab Tools offers yet another detailed pagespeed report for free.
The report gives you an overall score. It’s both a numerical and a letter score.
After that, you’ll see letter grades for each optimization test. You can click on any line item to get more detail.
One of the best features of the Yellow Lab Tools test is that you can bookmark your results. That way, you don’t have to run the test all over again to revisit the report.
That comes in handy because the tool might queue your request and take some time to run the report.
Sucuri Load Time Tester
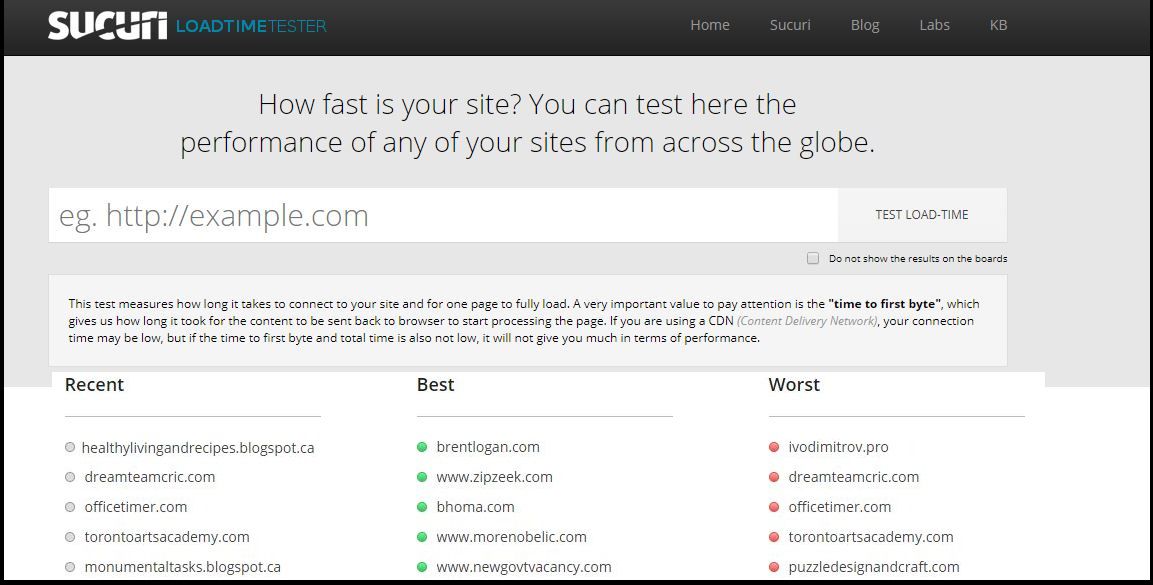
If you want to run a quick test to see how long it takes your page to load in several cities around the world, take a look at the Sucuri Load Time Tester.
Just enter your URL, click the “TEST LOAD-TIME” button, and wait a few seconds for the results.
The report will show you the connection time and time to first byte for the various locations.
Sucuri Load Time Tester will also show you a connection time graph at the bottom.
Pagespeed Tools – Google Mobile Scorecard
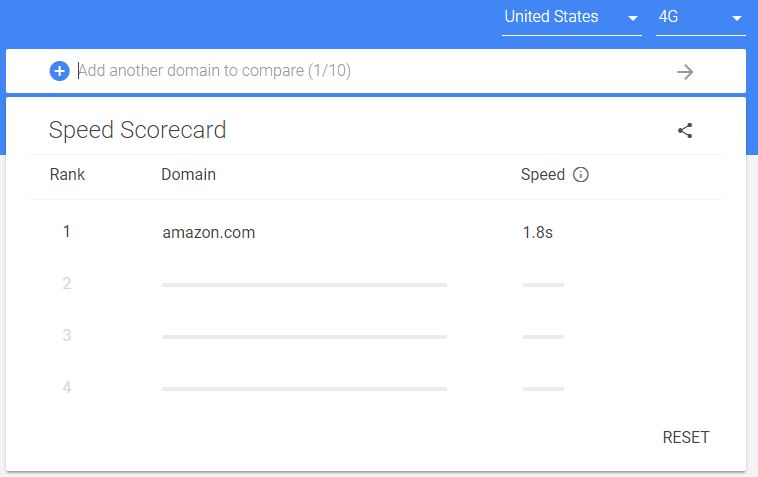
Yet another Google tool is the Mobile Scorecard.
It’s simpler than PageSpeed Insights, but it offers an impact assessment that shows you how much more money you can make by speeding up your site.
Just plug in your domain. Be sure to use only the domain name and not the full URL of any specific page on your site.
Then, click the arrow pointing to the right.
Very quickly, the tool will tell you how long it takes to load your page. That, in and of itself, isn’t terribly useful as you could get that info anywhere.
Scroll down a bit. You’ll see a section entitled “Calculate the Potential Revenue Impact.:
Below that section, you’ll find a number of form fields. The domain name and Current Speed fields are already pre-populated.
Fill in details for Average Monthly Visitors, Average Order Value, and Conversion Rate. You’ll likely have to use some of your analytics tools to find that info.
Once you’ve filled out all three of those fields, scroll down a little bit more to check out the Impact Calculator. It’s a slider that you can move around.
Move that slider to the left. The farther you move it, the more you’ll see the potential revenue impact increase.
That number tells you how much more money you can make if you improve pagespeed by the number of seconds you specify with the slider.
It’s a good report to show your manager or client if you’re looking for a good reason to get some additional funding to improve page load time.
Google Analytics Site Speed Report Pagespeed Tool
Hopefully, you’re already using Google Analytics. It offers a wealth of info (for free) about your website.
It also has a Site Speed report. That report will tell show your average page load time, average redirection time, average server connection time, and average server response time.
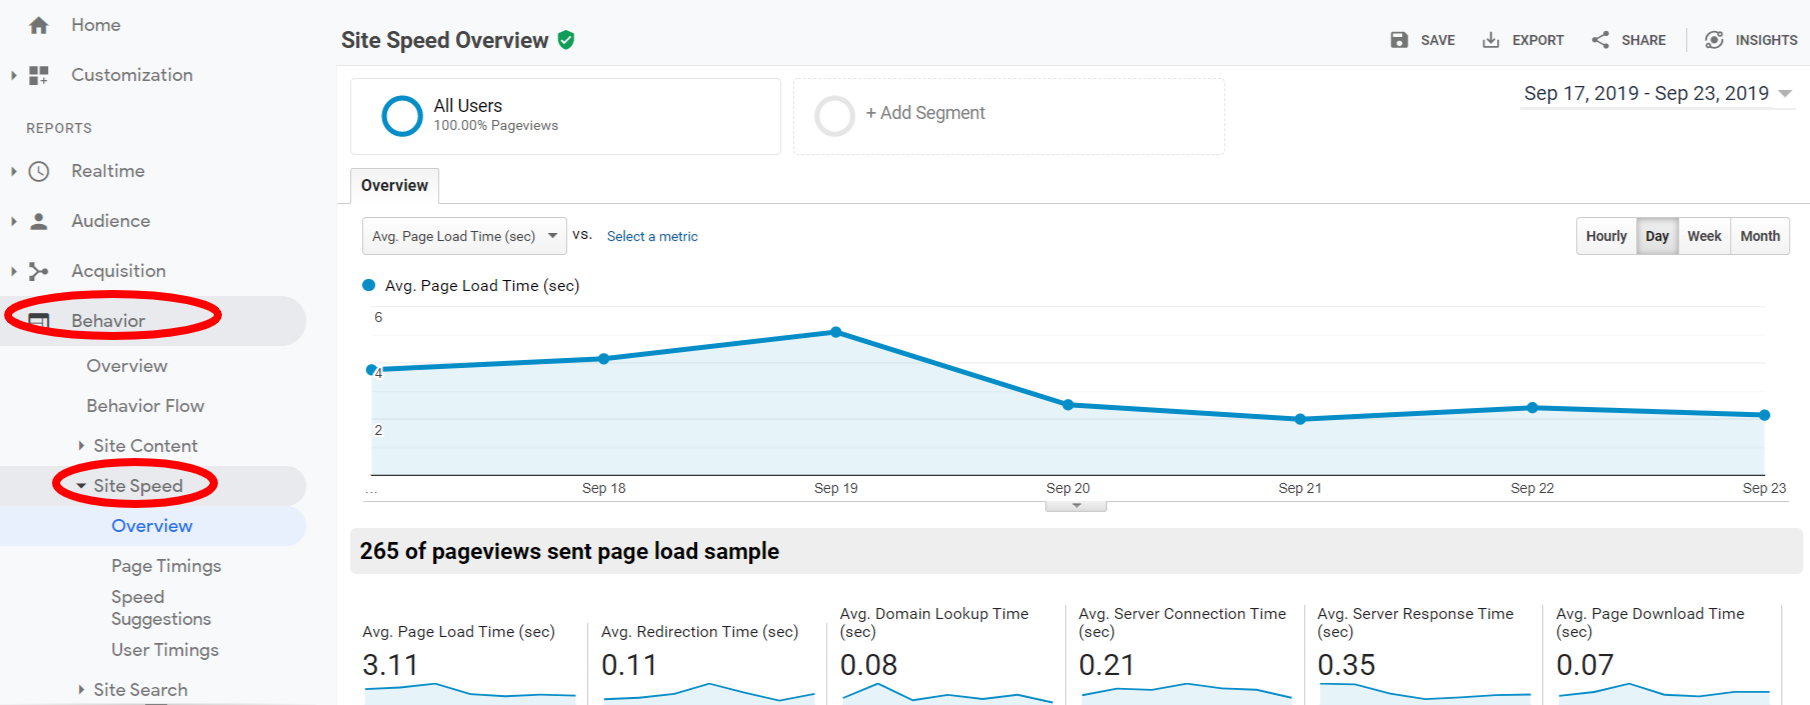
Use that report to find out if your site is loading too slowly for visitors. Although it won’t give you the same level of detail as some of the other tools, you’ll get a good overall picture of your site speed.
To view the report, sign in to Google Analytics. Then, navigate to the view for your website.
Click on “BEHAVIOR” on the left-hand menu. In the context menu that appears, select “Site Speed.”
There’s only one Site Speed report, so you don’t have to worry about clicking anything else. You’ll see the report on the right-hand side of the screen.
AMP Validator
If you’re using accelerated mobile pages (AMP) to deliver pages quickly to mobile visitors, then you need to know about the AMP Validator.
Why? Because you should be confident that your AMP code is valid. Otherwise, Google won’t index the page.
All you have to do is visit the AMP Validator tool and paste in the URL of your AMP page. Alternatively, you can also copy and paste your page code into the white box.
Once that’s done, just click on the “VALIDATE” button on the right-hand side. Hopefully, you’ll see “Validation Status: PASS” just below the white box that contains your web page code.
If your page fails, you’ll see all the reasons why it failed below the white box. That way, you can take corrective action.
WordPress Pagespeed Tools
Thus far, we’ve looked at pagespeed tools you can access in the cloud. Now, let’s dig deeper and look at some plugins that you can use to check your website load time.
P3
The first, and probably the best, is the Plugin Performance Profiler by GoDaddy, often called P3.
You install it just like you would install any other WordPress plugin.
After you activate it, click on “Plugins” on the left-hand menu in your WordPress admin console. Select “Installed Plugins” from the context menu.
Scroll down to find the P3 plugin. The plugins are listed alphabetically by default so you shouldn’t have any trouble finding it.
Underneath the name of the plugin, you should see “Scan Now” as a link. Click that link.
On the page that appears, click the “Start Scan” button. It will be towards the left in the middle of the screen.
On the popup that appears, leave the Scan name field alone and click “Auto Scan.”
P3 will take some time to scan your website. Go get a cup of coffee (or whatever beverage you use as a coping mechanism).
Once the scan is complete, click the “View Results” button on the popup.
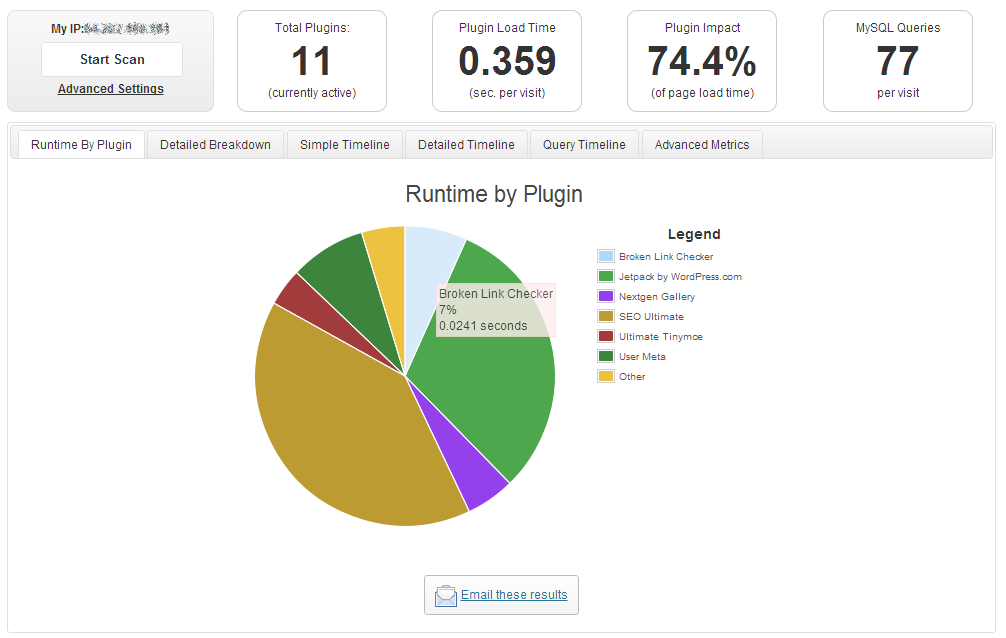
You’ll see a new page that displays a pie chart and some numbers at the top. Pay close attention to the box labeled “Plugin load time.” That’s the amount of time your website takes to load all of your WordPress plugins.
Next, have a look at the pie chart. You’ll see how long each plugin takes to load as a percentage of the overall load time.
What can you do with that info? The answer is simple: get rid of plugins that are causing your site to load slowly.
If some of those plugins are giving you features that your site absolutely must have, look at alternative plugins that provide the same features. They might be faster.
Also, think about removing plugins that you really don’t need but are just “nice to have.”
Consider this: if you get rid of 4 plugins that each add about .2 seconds to your load time, you’ve just increased your site speed by almost a second!
Now, go back and visit the Google Mobile Scorecard tool mentioned above and see how much more money you can earn by improving your pagespeed by almost a second.
Once you’ve used P3 to optimize your site, you can get rid of that plugin, too.
P3 is rated 4 / 5 stars and has more than 100,000 active installs.
Pagespeed Tools – WP Super Cache
WP Super Cache is a WordPress plugin and another pagespeed tool. It doesn’t analyze your site speed but helps you deliver content faster to visitors.
How does it do that? By creating static HTML from your WordPress site pages. That way, the server doesn’t have to go the database every time to render content.
WP Super Cache will also compress pages to speed up delivery even more.
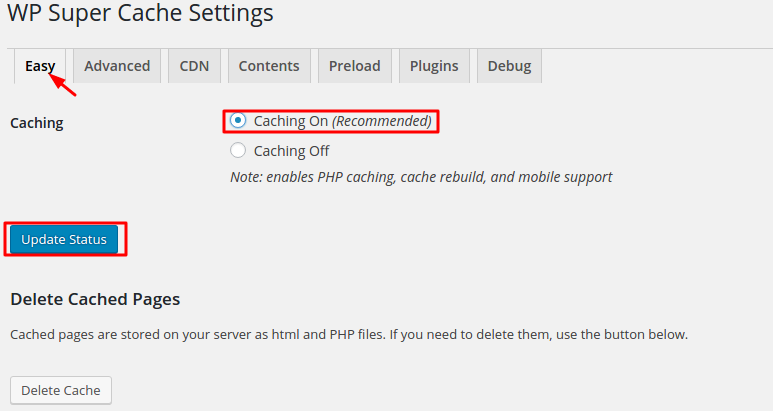
Keep in mind: there’s a whole science to setting garbage collection times. That’s when the plugin will delete old, static files.
What’s the best time? The answer to that depends on how many unique users you get every day and how “fresh” you need the content to be when they arrive.
You’ll likely have to experiment to find the right answer.
WP Super Cache is rated 4.5 / 5 stars and has more than 2 million active installations.
W3C Total Cache
The W3C Total Cache WordPress plugin touts itself as “the only web host agnostic WordPress Performance Optimization (WPO) framework recommended by countless web developers and web hosts.” They share they’re trusted by a range of reputable companies with websites, not the least of which are AT&T, Steve Souders, Mashable and Web Designer Depot.

The plugin supports CDN management, AMP, SSL, page compression, browser caching, and database object caching.
W3C Total Cache also offers a nifty reporting feature so you can get some performance insights.
Its main competitor, unsurprisingly, is the aforementioned WP Super Cache. Usually, webmasters select one of the two tools, but not both. That would be overkill.
The plugin is rated 4.5 / 5 stars and has more than a million active installs.
Smush Image Compression and Optimization Pagespeed Tool
Are overweight image files bogging down your website responsiveness? If so, then have a look at the Smush Image Compression and Optimization plugin.
How does it work? It scans every image you upload and trims it down to a more manageable size. It will even scan images you’ve already uploaded if you’ve got an existing website.

You can also use the tool to compress images stored in folders that aren’t part of your WordPress media uploads.
The tool supports all the known image formats, including NextGEN images, images stored on Amazon S3, and images in all theme and plugin packages.
Smush is rated 5 / 5 stars with more than a million active installs.
What About Drupal and Magento’s Pagespeed Tools?
Of course, WordPress isn’t the only content management game in town. There’s also Drupal and Magento, who have some pagespeed optimization tools of their own.
With Magento, there’s a Google Page Speed Optimizer extension. You can use that to improve your load time.
It’s not free, though. It costs $149+ as of August 2020.
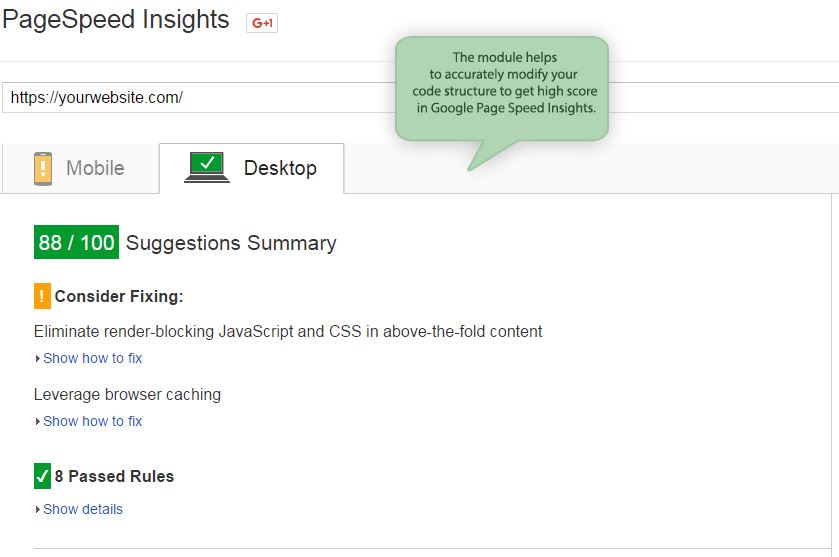
If you do decide to go with it, the extension promises give you a high score with PageSpeed Insights. It also minifies your CSS and JavaScript.
When it comes to Drupal, it looks like your best bet is to use the Drupal Boost module. Like WP Super Cache, it offers static page caching to improve performance. It also uses a built-in crawler so that your expired content is quickly regenerated.
Wrapping Up Pagespeed Tools
As you can see, there are plenty of pagespeed tools that you can use to fine-tune your website.
Bookmark the services that best suit your needs and visit them regularly. Also, install the plugins that are appropriate to your environment so that you can deliver a great user experience for your visitors. With page speed an increasingly relevant ranking factor since the news of Google’s Core Web Vitals, this is something you won’t want to ignore for your SEO checklist.


