In 2026, finding the “best time to post” has evolved from a guessing game into a science of Predictive Distribution. With Instagram’s algorithm now prioritizing “Shareability” and “Time-to-Direct-Message” over simple likes, your timing strategy must be more precise than ever.
In this guide, Senior Social Media Strategist, Josh Rohr, will explore how posting times can impact engagement on Instagram and reveal the best times to post in 2026. Using the latest data and analytics, we’ll guide you through creating a successful content schedule for both B2B and B2C audiences.
What You’ll learn:
- Why Timing Matters
- What is the Best Time to Post on Instagram?
- How Does the Algorithm Affect Timing?
- Increase Your Instagram Engagement With Timely Strategies
- Advanced Tips and Common Pitfalls
- Best Times to Post on Instagram FAQs
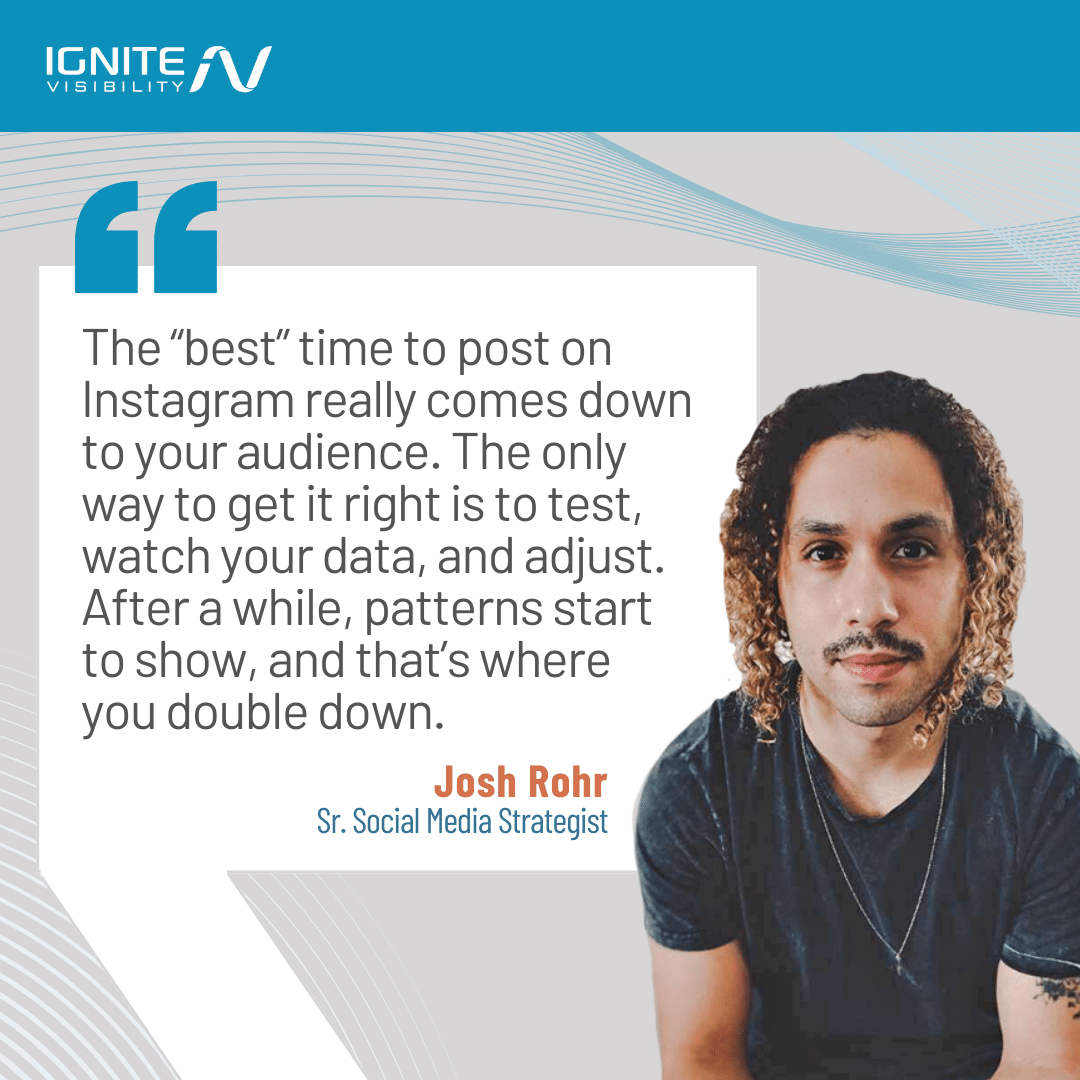
My Expert Opinion on the Best Time for Instagram Posts
The best Instagram posting hours aren’t universal—you’ll need to pinpoint when your audiences are most active based on your industry, region, and demographics. However, there are some case studies showing that there are some broad trends, such as posting from 3 AM to 6 AM to drive engagement by appealing to those early birds.
To pinpoint the best IG posting times, you need to do some research into your unique market. Are your audiences early birds, or do they tend to spend late nights online? Maybe your target audiences live in varying time zones, which could also indicate the optimal Instagram posting time.
In any case, it’s important to test and refine your campaigns to determine when to promote on Instagram. Over time, you’ll be able to figure out when you’ll be able to effectively boost brand awareness and recognition and drive the most conversions.
Why Timing is a “Ranking Signal,” Not a Rule
Initially, Instagram was chronological. Then, it was interest-based. In 2026, it is Predictive. The algorithm doesn’t just look at who is online; it looks at who is in a “high-intent state” to interact.
Recency still matters, but it has been replaced by “Freshness Windows.” When you post at the optimal time, you trigger a “Conversation Velocity” signal. If a post gets 50 shares in the first 10 minutes, the AI categorizes it as viral and pushes it to the Explore page for 48+ hours.
At the same time, there are some common misconceptions about the best time for Instagram posts, such as the universal belief among some marketers that a particular time is great for reaching all audiences (e.g., “it’s always best to post at 9 AM on Wednesday”). Generally, datasets around the best time to post on Instagram differ from source to source.
Determining when is the best time to post on Instagram also doesn’t guarantee success with the algorithm, as the quality of your content must also be worthy of high rankings, especially if you want to extend its freshness window.
Ultimately, the best time to post on Instagram today will depend on many factors unique to you and your audience. While industry averages may give you a good starting point, you need to look at your own Instagram Insights to pinpoint the best times to post on Instagram, potentially over time after conducting A/B testing.
Best Time to Post on Instagram by Day
Easily put: the best time to post on Instagram is when your users are most online. Since the Instagram algorithm is designed based on user habits, your posting schedule should follow it, too.
The optimal posting times vary depending on your audience and industry. However, studies from Hootsuite and Later suggest that these are the general best times to post:
- Monday (11 AM-2 PM and 5 PM-9 PM): This is the best time to post on Instagram on Monday as people catch up on what they missed during the weekend, with people often seeking out more inspirational and motivational content to prep them for the week ahead.
- Tuesday (10 AM-4 PM and 5 PM-6 PM): People are often in full work mode during this day, but they’ll take some time during late-morning breaks and post-work commutes to take a look at Instagram content.
- Wednesday (11 AM-1 PM and 6 PM-9 PM): This is the day when people are often at their busiest, and they’ll be looking for occasional distractions on Instagram, often during lunch breaks.
- Thursday (9 AM-1 PM and 6 PM-9 PM): Like Wednesday, this day of the week tends to be extremely busy for most, but they may turn to Instagram for some inspiration ahead of the weekend, seeking entertainment or travel content.
- Friday (11 AM-2 PM and 4 PM-9 PM): Engagement on Fridays tends to build throughout the day, but the peak times to post to Instagram fall in the early evening when people are looking to escape work.
- Saturday (9 AM-3 PM and 5 PM-8 PM): This day tends to see minimal Instagram engagement, as people are often busy living their lives. However, the best hours to post on Instagram are in the mornings and evenings, when users aren’t out and about for the weekend.
- Sunday (8 AM-2 PM and 7 PM-10 PM): While the mornings might not get much engagement on this day, the evenings are often the peak hours of Instagram on this day, as people want some last-minute entertainment before the work week begins.
Additionally, here’s a heatmap from Buffer showing the best Instagram posting hours across all regions:
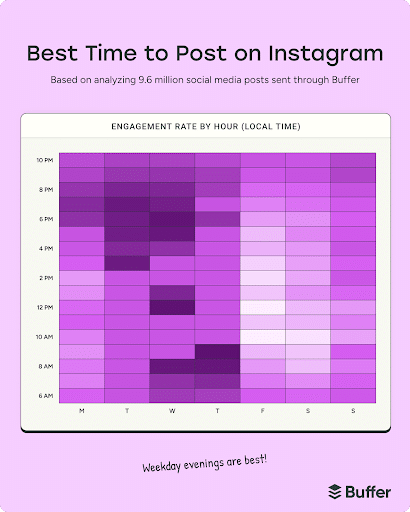
These times are based on global engagement patterns, but every business should consult its Instagram Insights to see when their followers are most active.
Pro Tip: If your data shows your audience peaks at 8:00 PM, you should post at 6:30 PM. This allows the “Test Period” to conclude just as the majority of your followers log on, ensuring your content is already “warmed up” and favored by the algorithm.
Best Time to Post on Instagram by Industry
While general best times are useful, industries see different patterns based on user behavior.
Here are the best times to post on Instagram based on current stats from sources like Viraly and Adobe:
| Industry | Best Days | Best Time | Content That Wins |
| Media and Entertainment | Sunday, Tuesday, Wednesday, and Friday | 1 PM (Sun), 7-8 AM (Tue), 5 PM (Wed), 2-4 PM (Fri) | Short-form videos, industry news |
| Consumer Goods/Retail | Monday, Tuesday, Wednesday, Friday | 7-11 AM (Mon), 5-7 PM (Tue), 9 AM (Thu), 6-10 AM/5-9 PM (Fri) | Product demos, user-generated content, shopping Reels |
| Dining, Hospitality, and Tourism | Wednesday and Sunday | 11 AM – 3 PM (Wed), 10 AM-12 PM (Sun) | High-quality food images and videos, travel, UGC, destination Reels |
| Healthcare and Wellness | Monday, Wednesday, Friday | 8-10 AM, 6-8 PM | Educational tips, fitness routines, mental health check-ins |
| Nonprofit Orgs | Wednesday and Thursday | 10 AM – 1 PM (Wed), 2 PM – 5 PM (Thu) | Impact stories, community spotlight, urgent calls to action, emotional storytelling |
| Tech and B2B | Tuesday, Wednesday, Thursday | 9 AM – 1 PM | Industry news, insights, tips, tutorials |
| Fashion and Beauty | Thursday and Friday | 11 AM – 3 PM | Trendy Reels, product launches, flash sales |
| Finance and Consulting | Monday and Wednesday | 9 AM – 12 PM | Financial tips, case studies, infographic carousels, Q&A sessions |
The Best Time for Instagram Posts for B2B vs. B2C Industries
The best Instagram posting hours will largely depend on whether you’re in a B2B or a B2C vertical.
Naturally, the best time to post an IG Story or other content will be more structured in B2B industries involving busy professionals. Generally, the early hours and midday will be some of the best times to post on Instagram, when professionals are either getting ready for the workday or taking a lunch break (Approx. 11 AM to 1 PM).
While this routine might be similar to B2C audiences, these audiences might have more free time during the weekends when they have most of these days off. Professionals, on the other hand, could be busy even during these periods.
Best Time to Post on Instagram for Engagement: Globally vs. Locally
Another factor influencing the best time for Instagram posts is whether you’re targeting local or global audiences.
When targeting a global audience, the best times to post on IG may fall in the early mornings and evenings while factoring in time zones and cultural differences.
If you’re targeting locally, you should consider local habits in your area, including your audience’s daily routines, Instagram habits, and, again, time zones.
Best Time to Post on Instagram Based on Format: Reels vs. Stories vs. Feed Posts
On Instagram, the best time to post will also depend on the specific format you want to use. Certain datasets might aggregate formats, but it’s best to test each format separately to see which works and when.
Here is a breakdown of the different formats and the best hours to post on Instagram based on testing hypotheses for each.
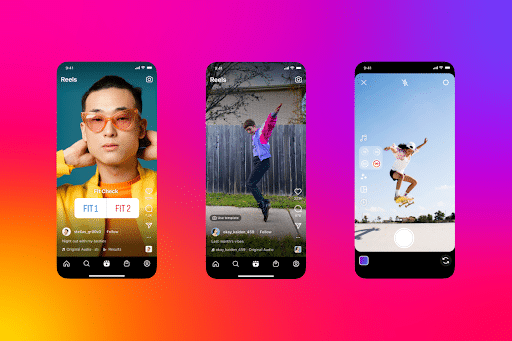
Instagram Reels (For Discovery and Reach)
Instagram Reels are great tools for maximizing your reach with social media and attracting new audiences.
These are short videos that appear in the Reels section of Instagram and Facebook.
The peak times to post to Instagram with Reels tends to be mid-week on Wednesdays and Thursdays, especially during the mornings between 9 AM and noon when people are looking for some brief distractions.
Also, try posting in the early morning hours around 5 AM to 7 AM to let your Reels “warm up.”
Here are some strategies to try with your creative design for Reels:
- “Loop” hooks that use a text overlay that may take too long to read before the Reel finishes, encouraging users to watch the video on loop
- A combination of a visual hook, an audio hook, and a text hook for maximum engagement
Instagram Stories (For Retention and Sales)
Another type of content you can use is the Instagram Story, which is a brief video that only stays up for 24 hours before disappearing.
When testing Stories, shoot for posting around two to three times per day to keep audiences engaged and tuned in. B2C industries tend to find the peak hours of Instagram to be around 6 PM to 9 PM, while B2B verticals may want to post during lunch hours at 11 AM to 1 PM.
Creative strategies to use here include:
- An interactive hook that starts the Story with a slider or poll, which can drive initial engagement and get your video to more followers
- Storytelling hooks like “How I almost lost thousands of dollars” or “Here are three tips that saved me,” building an emotional connection with audiences
Feed Posts and Carousels (For Authority and Saves)
Suggested posts and carousels are also great for building topical authority and earning more saves.
It’s best to post these when your audience is most active, boosting “Conversation Velocity.” Tuesdays and Wednesdays in the late morning/early afternoon hours often see a lot of post and carousel engagement.
Some strategies to optimize your post creative include:
- “Save-worthy” hooks that promise something of a cheat sheet or transformation
- Carousels with five to 10 slides that increase “time spent on post” to improve rankings
- SEO hooks with three to four keywords in your caption
Time Zones and Global Audiences
The best time to post on Instagram may also depend on the time zone of your target audience.
To keep your strategy more focused, choose one or two core zones to target. Also, try staggered posting that involves posting content at various times or across multiple platforms to increase overall reach.
Additionally, prioritize local peak times to post to Instagram to make sure your posts are consistently a hit among your audiences.
Here are some guidelines around the best times to post on Instagram according to time zone:
- Arabia Standard Time: According to Hootsuite, the best Instagram posting times in this time zone are on Thursdays from 2 PM to 4 PM.
- Atlantic Standard Time: The best hours to post on Instagram in AST are 7AM to 10 AM on Thursdays.
- Central European Time: For this time zone, the best time to post on Instagram is Monday (7 PM to 8PM) and Thursday (4 PM to 6 PM).
- Central Standard Time: Post around 11 AM on Wednesdays or 8 AM to 12 PM on Saturdays to connect with audiences in CST.
- Eastern Standard Time: Post in EST around 11 AM on Saturday when people are most engaged with Instagram content.
- Mountain Standard Time: This time zone tends to be ideal for targeting Saturdays around 9 AM, when people are kicking off their weekend.
- Pacific Standard Time: Like MST, post in PST around 9 AM on Saturdays.
- Coordinated Universal Time: For UTC, post either between 2 PM and 7 PM on Mondays, 4 PM to 7 PM on Tuesdays, or 11 AM to 4 PM on Thursdays.
Just remember, these times aren’t universal for all people within those time zones; instead, try to pinpoint the best times with different posting times, potentially through A/B testing to determine which time yields the most engagement.
How to Find Your Best Times to Post on Instagram
On Instagram, the best time to post won’t likely be clear until you develop a specific strategy. There isn’t a one-size-fits-all solution for businesses, so you’ll need to consider factors like your industry and audience to nail your timing.
Here is a process you can employ to identify the best Instagram posting times:
1. Establish a Baseline
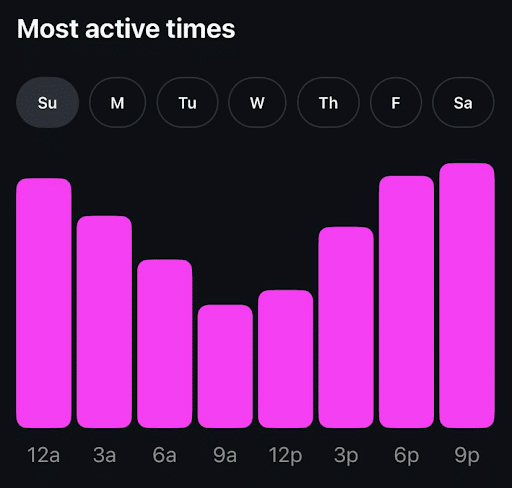
The first step to take is to establish a clear baseline confirming where you currently are, ideally using Instagram Insights data.
Within Instagram Insights, you can find “Most Active Times” within the Professional Dashboard under “Total Followers.”
From there, you can determine where you want to take your strategy and set some specific goals for views, engagement, and other metrics.
Also, consider the type of Instagram content that’s reaching people, be they Reels, Stories, or feed posts.
2. Form a Hypothesis
Analyze existing data to identify the peak times, with a focus on the 30 to 60 minutes prior to each spike.
You can then construct a hypothesis based on this data to inform your approach to posting.
For example, if you find that your audience peaks at 6 PM, it’s likely that posting around 5 to 5:30 PM will boost engagement.
3. Create a Test Calendar
With your hypothesis in place, develop a content calendar to test it.
It’s best to test for around three to four weeks to confirm that results are valid. In weeks one and two, post during the hypothesis time, and during weeks three and four, you can post at another time to compare results.
At the same time, keep the type of content consistent to ensure that timing is the sole variable for measurement.
Tools like Hootsuite, Buffer, and Later can help you schedule your Instagram posts and test the hypothesis.
4. Measure the Results
Using Instagram Insights and other analytics tools, you can then measure and analyze the results with your data.
See which times see a maximum “Most Active Time” and get the most engagement from audiences, tracking them against your goals to gauge success.
There are many metrics you could track, from “Most Active Time” to clicks, impressions, likes, comments, and shares.
Source: Instagram
5. Iterate to Refine
After measuring the data and gauging performance, make any necessary adjustments to your strategy as needed.
Focus on posting around the peak time slot, or choose a new variable like day of the week if you’re not seeing peak performance at any time.
A monthly review of your data can help you continually refine and perfect your strategy until you’re getting the kind of results you need.
How the Instagram Algorithm Affects Timing
Initially, Instagram displayed content in reverse chronological order. This changed in 2016 when the platform began prioritizing content based on user interest, relationships, and engagement. Although Instagram still considers recency, the current algorithm favors posts that spark interactions.
In 2026, short-form video content, especially Reels, plays a significant role. Engaging, timely, and authentic content is essential, and using features like polls or interactive stories increases your chances of reaching more users.

Run a 4-Week Testing Period
In figuring out the best IG posting times, consider setting up a four-week testing period that helps you experiment with different elements, including the optimal Instagram posting time and more.
An example might look like:
- Week 1: Try out different types of posting visuals and creative designs, including certain images and videos, image ratios, and filters.
- Week 2: You can then take this week to test different captions, incorporating different tones, lengths, and calls-to-action.
- Week 3: Test out different types of posts, including Instagram Stories and traditional in-feed posts, seeing which kinds of content your audience responds to most.
- Week 4: Finally, you can pinpoint the best time to post an IG Story and other content based on when your audience is most likely to engage. Start with market research and Instagram Insights and then hone your timing over time as you measure engagement.
Before developing your testing schedule, determine what goals you want to achieve with your posts. Also, through a brand messaging strategy, you can ensure your Instagram content aligns with your branding to develop a clear brand identity across your posts.
Track the Right Metrics
To determine whether your content is meeting your goals and further confirm the best time to post on Instagram for your business, you must track the most appropriate metrics.
Some key metrics to track include:
- Reach: This refers to the number of unique users who have viewed a post, Reel, Story, or another post.
- Impressions: Another critical brand awareness metric that measures the number of times a post has appeared in front of users, regardless of whether the person actually saw it or engaged with it.
- Engagement Rate: This percentage tracks the number of people who’ve liked, shared, or commented on a post.
- Saves: This marks the number of times people have “saved” or bookmarked a post, which indicates that people found your content engaging and, even if they couldn’t view it at the moment, planned to save it for later.
Based on how your content performs for one or more of these metrics, you can continually run A/B tests and experiment with different timing to pinpoint the optimal time to post on Instagram.
Choose KPIs by Goal
Before you select your metrics, you need to have a goal set. For example, if you want to maximize reach, reach and impressions will matter most when measuring the results. Conversely, if you want to boost more engagement on your website and sales, you would focus more on clicks and conversion rate.
However, you should do what you can to avoid vanity metrics like followers, likes, and video views, unless they contribute to your goal.
Increase Your Instagram Engagement With Timely Strategies
Run Paid Promotions
If your goal is to grow an audience, Sponsored Posts are a great way to put your content in front of a new crowd. Paid ads remove timing concerns, as Instagram handles scheduling, allowing you to focus on creative content and audience targeting.
Relevant Hashtags
There’s been some talk lately that hashtags are dead. This isn’t true. It’s no secret that Instagram posts featuring relevant hashtags receive higher engagement than those without. Use a mix of branded and community hashtags to increase your reach by helping you show up in related search results.
Content Format Matters
Reels generally outperform static posts, but you should experiment with various formats to understand what resonates with your audience. Adding captions also ensures accessibility for a broader audience.
By consistently posting at optimal times, engaging with followers, and leveraging insights, you can maximize your Instagram reach and effectiveness in 2025.
Be Interesting
Posting during peak hours means nothing if your content lacks personality. Instagram’s machine-learning algorithm aims to deliver the content you care about based on how you’ve interacted with similar content in the past.
Brands can take advantage of this by focusing on engagement and being authentic. What this means is, identifying hashtags that will help you get seen, along with high-quality visuals, and well-crafted captions. In other words, your goal is to push out posts people actually want to click on.

Advanced Tips and Common Pitfalls
While it’s essential to know the best times to post on IG and other platforms, there are some important mistakes to make that could compromise your Instagram strategy if you’re not careful.
Here are some common pitfalls to avoid with some additional tips:
Always Going With the “Best Times”
One mistake that many businesses make on Instagram is going for the universally best IG posting times, when this isn’t always the best approach.
For instance, you might want to target a hyper-niche audience that accesses Instagram and other platforms at very different times from broader audiences.
Also, the optimal Instagram posting time could vary greatly for paid posts, Stories ads, and other content outside of your regular posts.
Fatiguing Users
It’s good to post regularly at the optimal time to post on Instagram, but don’t overdo it. If you post too frequently, you could wind up annoying your audiences to the point of driving them away, or you could find yourself having a hard time developing consistently good post ideas.
Try to limit your posting to around two to three times per platform per week, once every other day or so, or just on the days when your audience is most active. This approach will keep you in your audience’s eyes while attracting engagement.
Not Keeping Up With Algorithmic Changes
If you’re not staying up to date on Instagram’s algorithmic shifts, you might miss changes in your performance and opportunities to improve timing.
Keep an eye out for any noticeable differences in your metrics, including reach and impressions, that might indicate a drop in rankings. You might also notice decreased engagement, lower hashtag visibility, or reduce appearances in Explore and other sections.
Based on these changes, you might want to change your schedule to identify the best time to post on Instagram for engagement.
Overposting Reels Without Retention
While Reels can be invaluable pieces of content on Instagram, they won’t count for much if they’re not helping with retention. If anything, posting too many Reels with low retention can lead to lower reach and less engagement.
As with any other type of content, Reels are all about quality over quantity, but you want to strike a balance of both to connect with audiences.
Ignoring Saves and Shares
These metrics are essential social media KPIs on Instagram for measuring the quality of your posts.
Plenty of saves and shares of your videos will indicate that people find your content not only engaging but worth spreading to their own followers.
High numbers of saves and shares are a fast track to higher rankings in Google’s algorithm, potentially greatly expanding your reach.
Frequently Asked Questions
1. What is the best time to post on Instagram for engagement?
The peak hours of Instagram will vary based on industry, audience, and location, but in many cases the best times fall on the mornings, lunch breaks, and post-office hours throughout the week and in the mornings on weekends.
2. How often should I post for optimal engagement?
To maximize engagement, you should post about three to five times per week for Reels and feed posts, while you may want to publish Stories daily to retain existing audiences.
3. What is the best time to post on Instagram Reels?
In most cases, you’re safe posting Instagram Reels from 9 AM to 12 PM throughout the week, along with early mornings and evenings outside of work hours. However, look at the data for your posts to better determine when to post.
4. Does timing differ for Stories vs. feed posts?
Because of their different nature, Stories and feed posts have different timing requirements. Stories are good for daily 24-hour updates that consistently engage existing audiences, while feed posts should aim to attract new audiences and extend your reach more permanently with less frequent posting.
5. How can I find my audience’s best time to post?
On Instagram, the best time to post can become clear in Instagram Insights in the “Most Active Time” report. You can also use tools like Buffer and Later to develop a content calendar and experiment with different posting times.
6. How often should a business post on Instagram?
Most businesses will benefit from posting around three to five times on Instagram with conventional posts and every day with Stories. However, the frequency will depend on when your audience is most active and the kinds of engagement your posts attract on a daily or weekly basis.
7. Do holidays/events change posting performance?
Yes, holidays and events could generate different types of engagement, depending on the audience and culture. Around these times of year, you can test your posting calendar to see what kinds of content engages audiences the most and when.
Want to Improve Your Social Media Marketing?
While finding the optimal posting time is crucial, it’s just one piece of the puzzle.
Combining well-timed posts with high-quality content, particularly Reels and interactive Stories, will help increase engagement on Instagram.
We can also help:
- Monitor Instagram Insights regularly
- Test different post times
- Adjust your posting schedule as needed to stay ahead in 2026.
Ready to level up your Instagram strategy in 2026? Contact Ignite Visibility today for expert advice on how to enhance your social media marketing.