So, you’ve officially got your Facebook ads up and running—now what?
The ongoing process of optimizing and measuring Facebook ad metrics is critical to the success of your advertising campaign. But in order to determine whether your Facebook ads are working for you, you’ll need to generate tangible results and takeaways.
In this post, Ignite Visibility Sr. Paid Media Manager Jenna Long will discuss the key Facebook Ads Manager metrics that will help drive profitable marketing results and impact your business’s growth and bottom line.
What We’ll Cover:
- Facebook Ads Metrics Explained
- Key Metrics to Compare
- Secondary Metrics that Impact Key Metrics
- Facebook Ads Comparison Tool
- How do You Know What’s Working?
Facebook Ads Metrics Explained
Facebook is one of the best places for brands to build their target audiences and generate revenue. But as more businesses join the platform each day, standing out becomes more and more competitive. That’s where Facebook ads come in.
However, publishing the ad and hoping for the best is not enough. Measuring Facebook ad success means your ad needs to be monitored and adjusted overtime to get the best conversion rate from your spending.
With so much data to sift through, how can you be sure which Facebook ads metrics are the ones you need to focus on? Which ones do you need to pay attention to and work to improve if your website isn’t meeting its goals?
To help you maximize ad spend, efficiency, and performance, we’ve outlined the top metrics you should compare in your next ad campaign.
Key Metrics to Compare
While awareness and engagement metrics are effective in demonstrating how your brand is growing and being perceived by the public, for the sake of this article, we’re going to concentrate on conversion-based metrics.
These are the true sales and revenue stats that directly affect your business’s ROI and scaling potential.
Conversion Rate
The conversion rate metric tells you the percentage of people who click your ad and go on to complete the purchase and become a paying customer. This is a key metric for Facebook ads since the overall goal of your ads is to convert as many users as possible.
Results
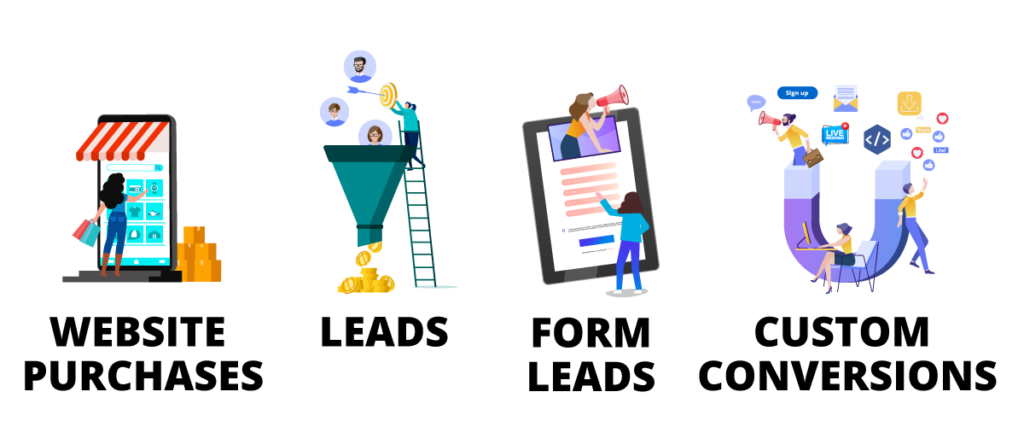
The following metrics illustrate whether or not the clicks on your Facebook ad led the customer to take a specific action:
- Website Purchases—Total number of transactions that were made on your site.
- Leads—Total number of potential customer contacts acquired, also known as “prospects,” through your website and marketing methods.
- Form Leads—Often referred to as “lead ads,” form leads allow the user to submit their contact information directly within the Facebook platform and track how many total form submissions occurred. You may then choose to remarket to these contacts through further curated ads with more urgent messaging, phone calls from your sales team, or email marketing in hopes of turning the warm leads into a full sale.
- Custom Conversions— Any event that occurs on your custom website can be tracked as a custom conversion using the Facebook Pixel. Other results you’re able to track for your custom conversion campaign include eBook downloads, webinar signups, and free trials – anything with a unique URL that wouldn’t fall under the usual conversion metrics.
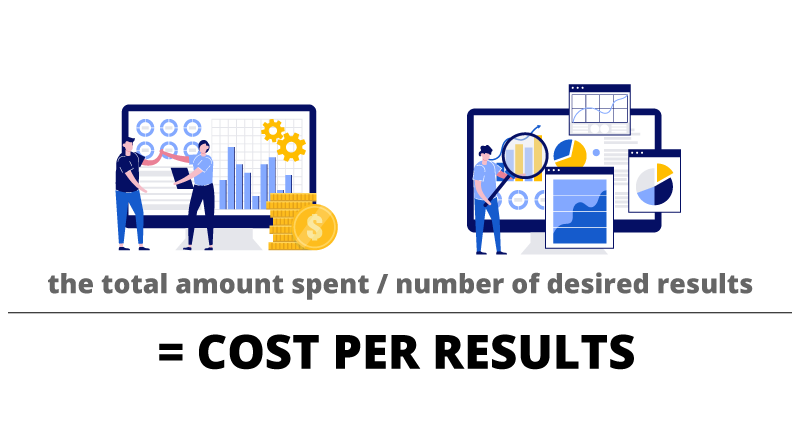
Cost per Result
One of the most important Facebook Ads Manager metrics, cost per result breaks down the amount spent per impression or conversion, or other metrics that formed the objective of a campaign. It is typically calculated by dividing the total amount spent by the number of desired results (ie. sales, leads, conversions, etc.).
These metrics can help you gauge how cost-efficient your strategies were in allowing you to reach your goals for a campaign. You can even use them to compare the performance of various campaigns that all share the same objective.
Cost per result can be impacted by numerous factors, including target audience, creative, and scheduling.
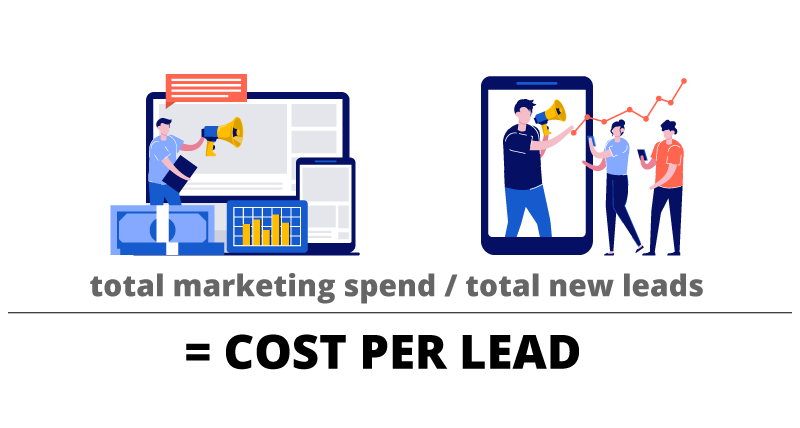
Cost per Lead
The cost per lead is the dollar amount you’re paying to attain each lead that’s generated from a Facebook ad or ad campaign.
To get this number, you’ll want to divide the total marketing spend by the total new leads.
Marketing spend involves adding up your time, ad spend, and any other third-party expenses.
Cost per Acquisition
Cost per acquisition is the cost you pay when someone takes action on your website through your Facebook ad.
These actions span page like, app install, link click, video view, a newsletter sign up, and similar conversions. The average cost per acquisition on Facebook ads across all industries is $19.68.
Total Conversion Value
Total conversion is a numerical value that’s assigned to specific conversions in order to represent their impact on your business.
This is a key metric for Facebook ads and can be summed up by adding conversion values like conversion value per cost, conversion value per click, and value per conversion.
These conversion values are designed to help you track, optimize, and report on your return on ad spend.
Return on Ad Spend
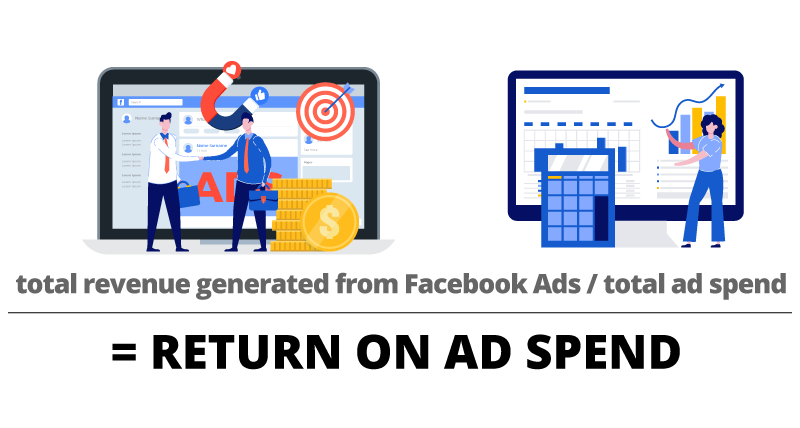
Return on ad spend is a marketing metric that measures the revenue your business earns for every dollar it spends on advertising. For all intents and purposes, return on ad spend is a synonym for another metric you’re likely familiar with—return on investment.
This is calculated by dividing the total revenue generated from your Facebook ads by your total ad spend.
Secondary Metrics that Impact Key Metrics
Now that we’ve covered the main Facebook ad metrics, here are a few others that you should also monitor to take your ads to the next level.
Cost per Thousand Impressions
As its name implies, this amount refers to the cost per thousand impressions, which is what your users would pay when 1,000 users come across your ad on Facebook.
Click-Through Rate
Click-through rate on Facebook is fairly straightforward. It’s the ratio that measures how often someone clicked on your ad to how many times the ad was viewed on the platform.
Until recently, Facebook was providing click-through rates for things like off-site clicks, likes, and event responses. These shouldn’t be confused with actual link clicks, as doing so could misrepresent the way your ad is actually performing.
Cost per Click
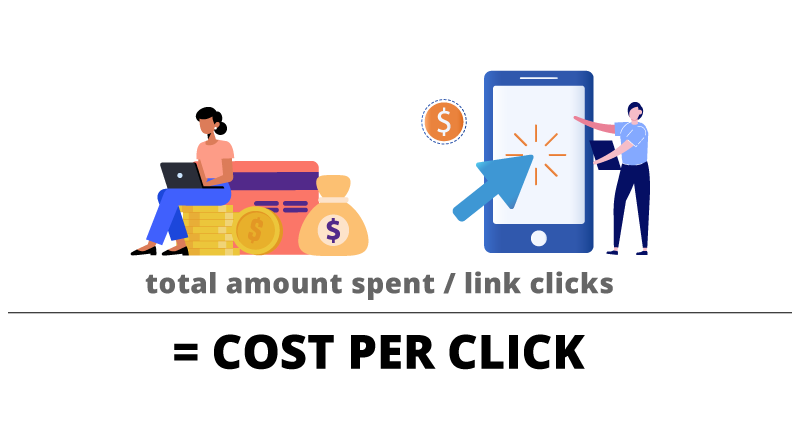
Cost per click tells you how much, on average, each link click will cost your business. This metric is often used to benchmark Facebook ad efficiency and performance.
This is calculated by dividing the total amount spent by link clicks.
Volume of Clicks
The volume of clicks refers to the total number of times someone clicks on your Facebook ad. This metric can also be used to determine the amount of traffic your ads are bringing to your website.
Impressions
Impressions are defined by Facebook as “the total number of times the ad referenced has been shown on the site.” This means that when a user sees an ad on the right side of the screen, an impression will be registered to your Facebook advertising account.
Unique Reach
Unique reach measures the total number of people who were shown your Facebook ad across different devices, formats, sites, apps, and networks.
For example, if someone views your ad on their smartphone, their desktop, and their tablet, your ad will receive three distinct impressions. Unique reach is what tells you whether each of those impressions came from a single user.
Facebook Ads Comparison Tool
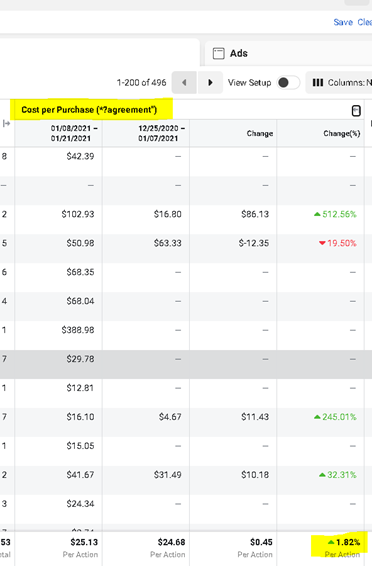
One of the best ways you can determine whether you’re experiencing better results is by comparing metrics from past campaigns, which will help guide your decision-making when it comes to budget, schedule, and formats for future Facebook ad campaigns.
First, you’ll want to choose the metrics you want to compare. The value of each metric will vary based on your campaign’s reach. For example, if you run a campaign to get people to download your company’s app, a metric worth looking at would be the cost per conversion or cost per app install.
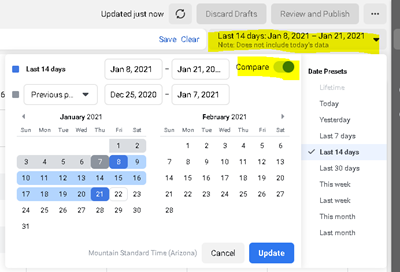
For a more general view, you can use the comparison toggle in the Facebook interface to compare campaign performances over a period of time, as well as key and secondary metrics.
How Do You Know What’s Working?
Tracking Facebook ad metrics is only part of the larger equation. The real value comes from understanding what your results mean.
If your conversion rates have improved, find out why and start taking all the necessary steps so you can scale up on those results.
Perhaps the offer was better, the creative was more impactful, or the copy promoted more urgency? Maybe your targeting was different? Can you manage to spend more next time to generate additional revenue?
If results haven’t improved, ask yourself why and consider adjusting future campaigns so they can perform better.
Do you need a stronger offer or more specific or broader targeting? More urgency in the ad copy? Or maybe a better landing page for a seamless user experience might do the trick?
Remember—it takes time to learn your market, identify your competitors, and get an idea of what exactly it is that your audience would like to see.
Wrapping Up
Having a solid understanding of your Facebook ad metrics is crucial to spending your marketing dollars wisely and boosting the ROI of your campaigns.
With thousands of metrics you could potentially track, it’s easy to get bogged down with the options available in Facebook Ads Manager.
However, if you take a look at the metrics mentioned above, you’ll start to see an uptick in how well your site does, resulting in better optimized, better-performing campaigns.
Remember, there’s never a better time to start measuring Facebook ad success than right now!