
45% of marketers say infographics are their favorite media format. It’s a quick, digestible way to share information with any audience.
Sadly, most companies think they’re hard to make, so they miss out on their benefits. In reality, making infographics is easier than ever—with no compromise on quality.
In this guide, you’ll learn why infographics are so useful, how to make them, and how to distribute them.
Why Create Infographics?
Infographics are graphic summaries of information. They use minimal text and maximum imagery to explain complex ideas in a quick, digestible way.
18% of B2B companies and 13% of B2C companies use them because of their powerful benefits:
- Increased shareability. Original graphics simplify difficult concepts. This provides the “a-ha!” moments that inspire sharing.
- Greater exposure. Your graphics will appear in image search results (Google, Pinterest, etc.) relevant to their topic, leading to more exposure.
- Better storytelling. Infographics help you explain your ideas in a clearer, more compelling way.
- Natural backlinks. Whenever other writers find your graphic useful, they will link to it and cite it.
- Thought leadership. Original graphics establish your brand as a thought leader and boost credibility. People know you’re serious about your professionalism if you can produce original, high-quality content.
- Better search rankings. Google looks for content providing a variety of rich media. One of the best forms of media is infographics, which provide quick and easy access to information.
How to Make an Infographic
24% of organizations wish they could make more infographics. The truth is they’re much easier to make than most people think.
Here’s how to make effective infographics without technical knowledge or outsourcing:
1. Pick an Idea or Topic
Your infographic is only as good as the idea it represents. Readers won’t get any of the benefits described above if it doesn’t provide value.
Here’s how you can reliably find useful topics to summarize as infographics:
Summarize an Industry Study
Infographics are an excellent way to present the hard work you put into your original industry study. Here’s an infographic that summarizes a data firm’s entire industry marketing report:
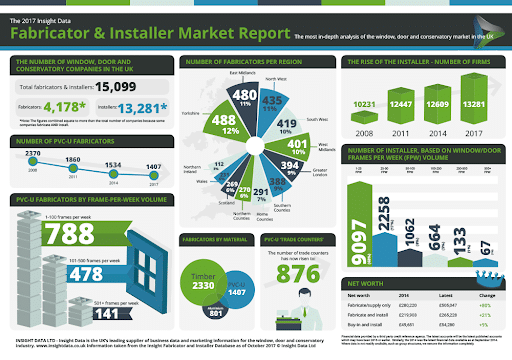
By turning industry reports into infographics like this, boring reports become fun to read. The information above is much easier to understand compared to a long data report.
Reinforce Blog Content
A visual aid can help you explain complex ideas in your blog posts. Since infographics are so comprehensive, they’re perfect for this.
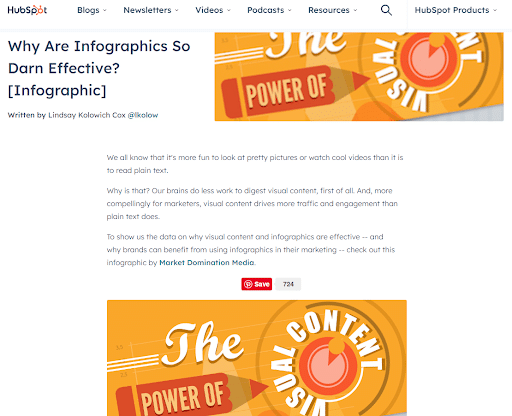
Target a Keyword
The right infographic can rank for a keyword all on its own.
In the below example, HubSpot created a post just to feature an infographic. Rather than being a visual aid for text, the infographic acts as content by itself.
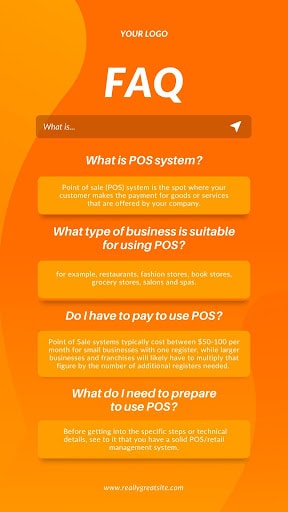
Answer FAQs
Visuals are a great way to provide clear answers. Infographics let you list out every common question about a topic with concise responses.
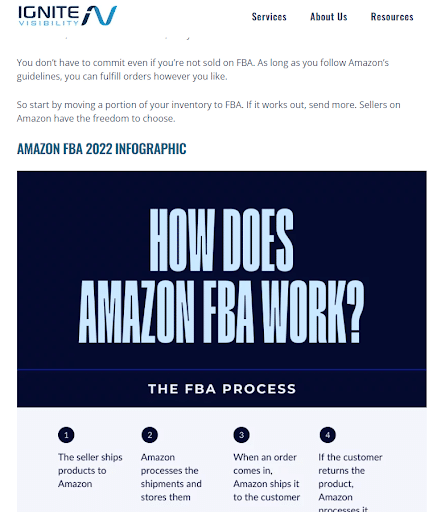
Create a Tutorial
You can simplify confusing instructions by turning them into a multi-step infographic.

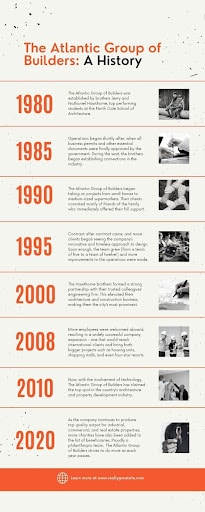
Create a Timeline
A timeline infographic is a great way to discuss topics spanning a certain period of time. Examples include explaining your company’s history, the evolution of a topic, or recapping a historical era.
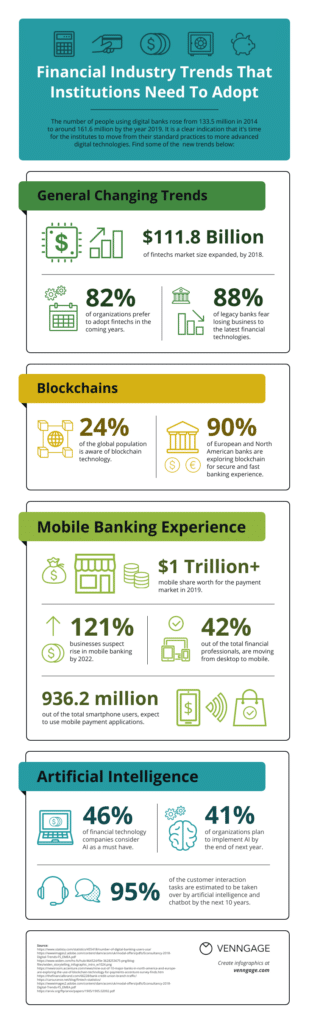
Highlight Industry Trends
Use your infographic to showcase certain trends in your industry that establish you as a thought leader. For instance, certain products or movements may experience more or less popularity from year to year, making them worth covering in an annual infographic following the latest trends.
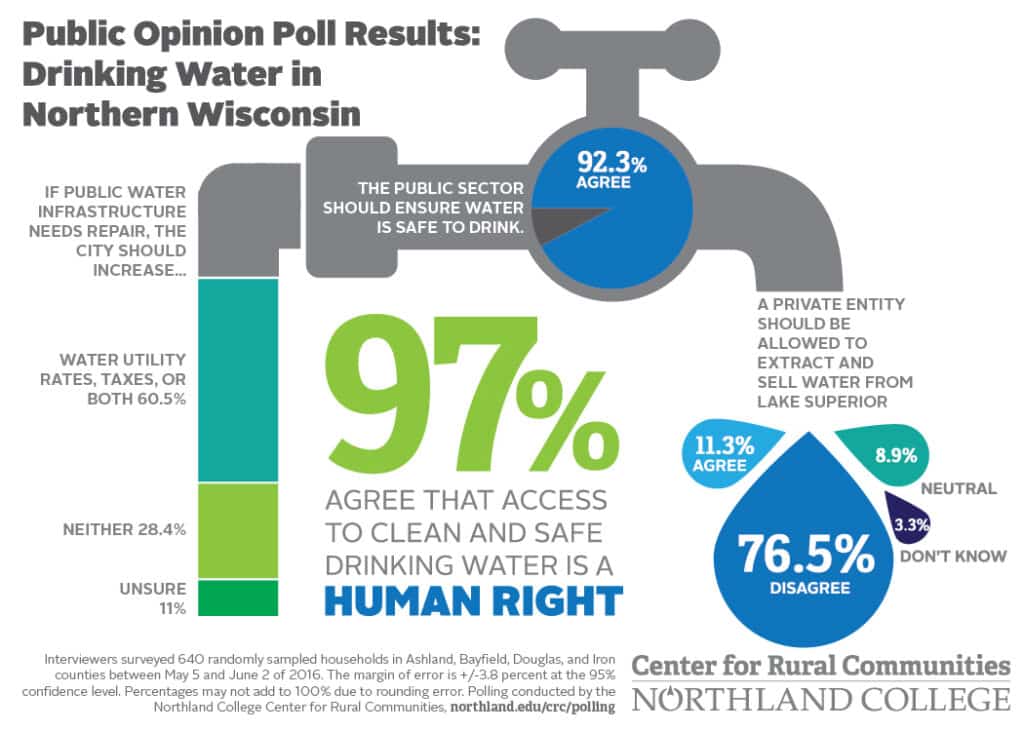
Visualize Survey and Poll Results
Maybe you’ve recently conducted a survey or poll of your audience, which could serve as the basis for an analysis of the results in an infographic. This visual could make it easier for you and your audience alike to understand what people want or their opinion of a certain topic.
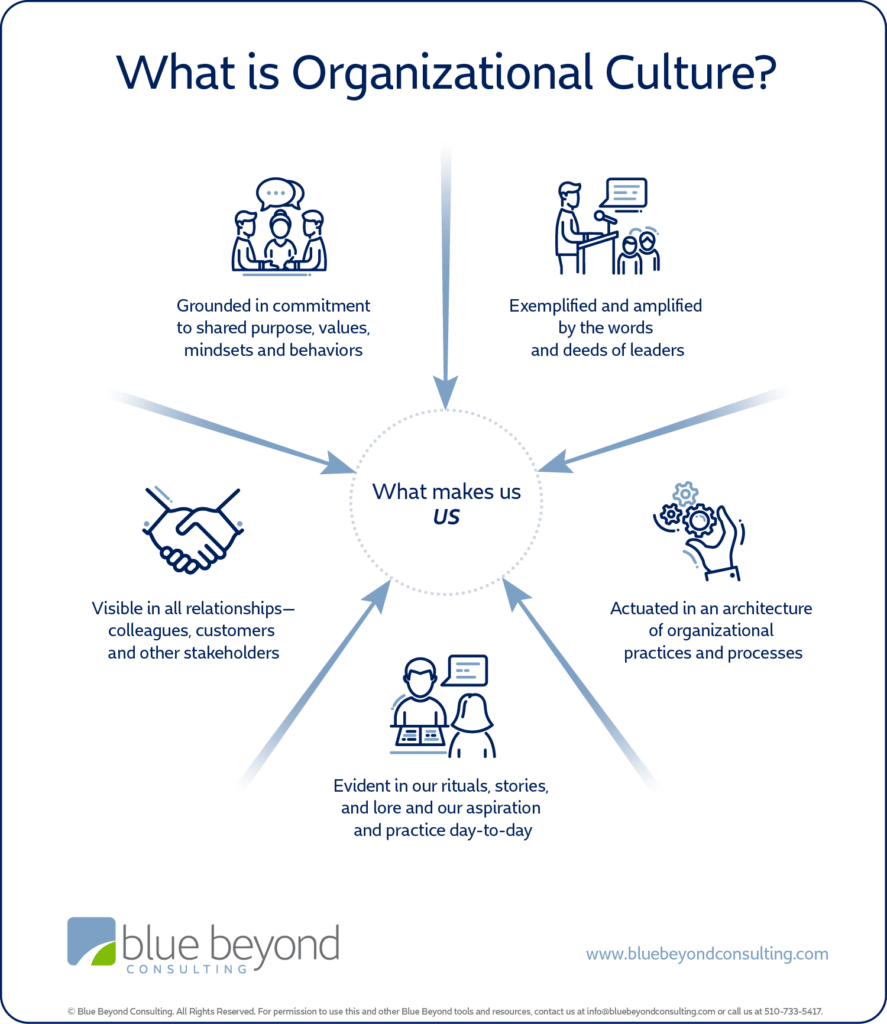
Break Down Your Company Culture
Yet another topic you can make an infographic around is your company’s culture. What kinds of hobbies do your employees engage in? What are their unique interests? What causes do they support and what is their philosophy? You can answer these and other questions in a visual that explores your company on a more personal level.
2. Identify Your Audience
Like content, infographics aren’t a one-size-fits-all solution. To know what information and details to include, you need to understand your target audience.
For example, a beginner audience will need information that’s obvious to advanced viewers. Managers will only need insight into more advanced topics, and so on.
Also, think about your audience’s demographics. You won’t know how to make an infographic without a detailed understanding of your target audience to ensure it resonates with it. Demographics could include age, gender, financial status, occupation, and other factors that influence their interests and the types of visuals that speak to them.
Take a look at competitors’ infographics and see how they’re connecting with a shared target audience. You can also look on social media or look into your existing customers to find out what kinds of visual content can get the desired results.
3. Collect Data
With your audience and topic in mind, it’s time to gather and organize all the data you’ll need for your infographic.
This data can be your first-party data, or it can come from a third party. If you use third-party data, be sure to cite it.
Not just any data will do, though. It should be relevant and in-depth enough to help construct a narrative around your infographic. It should make sense and ultimately work to tell a story that’s aligned with the overall topic.
Simplifying the process of creating visuals can also extend to other essential components for your brand. For instance, you can use a free online logo maker that allows you to design, customize, and download logos effortlessly without any charge. Tools like these make fundamental branding tasks easier and more accessible.
If you’re throwing all types of data into your infographic to see what sticks, you’re not going to make an infographic that engages—instead, you’ll likely bore or even confuse your audiences as they try to find a connecting thread that’s worth following.
4. Find a Template (Optional)
Using software like InDesign, you can create your own infographic from scratch. But you’re much better off using software like Canva, which has an endless number of templates.
Imagine you’re creating a timeline infographic. You can search “timeline” on Canva and find thousands of fully customizable timeline graphics.
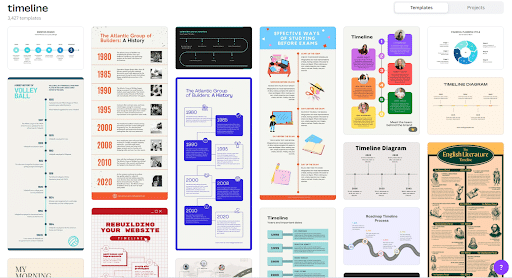
You can still make your infographic from scratch, but it’ll take a lot of time and skill. Templates make things much easier.
If you need some resources for infographic templates, there are plenty of places to look. For instance, Canva has multiple free templates you can try, giving you highly customizable infographic options that can guide you as you learn more about how to make an infographic for yourself.
Content creation tool Visme also has over 1,000 infographic templates to try. It even allows you to create them straight from your browser.
5. Start Your Design
If you decide to design your infographic from scratch, it’s time to gather all your data and start designing. Include these essential elements:
- Title – Tell people what your graphic teaches them with a descriptive headline.
- Subheads – To supplement your title, you must also include subheads that help create clear sections throughout the infographic. They’ll help people determine what each section is about as they move along the narrative.
- Graphics – Adding graphics like arrows, symbols, and other designs makes your infographic more readable. When you don’t use effective graphics, you’re missing the visual cues that make infographics so effective.
- Text – An infographic is obviously not all text. For simplicity, you shouldn’t include more text than necessary, but a certain amount is needed to cover the topic well. Avoiding jargon is crucial here as it can weigh down your infographic, turning an otherwise engaging visual story into something potentially boring and meaningless to your audience. If you need to get technical, do it sparingly and in language that simplifies the core concepts.
Make sure you have a good design by looking up inspiration for your infographic. For example, a search for “FAQ infographics” turns up tons of FAQ examples.
And if you’re using a template, all you have to do is fill in the information you gathered.
But no matter how you design, there are a few basic rules to follow:
- Visible Font Size – Make your fonts big enough so everyone can read them. People won’t read your infographic if they have to squint to read it.
- Comfortable Spacing – Your infographic can’t be cramped. Leave adequate spacing between graphics and text for best readability. You can make your content breathe a bit easier by incorporating white space that helps separate sections from each other. Otherwise, a cluttered infographic will overwhelm the viewer.
- Comprehensiveness – Don’t be afraid of making an infographic long. A good infographic fully satisfies the reader’s curiosity. At the same time, make sure the content you do have flows well throughout the infographic, which will keep readers moving along.
6. Stick to Your Branding
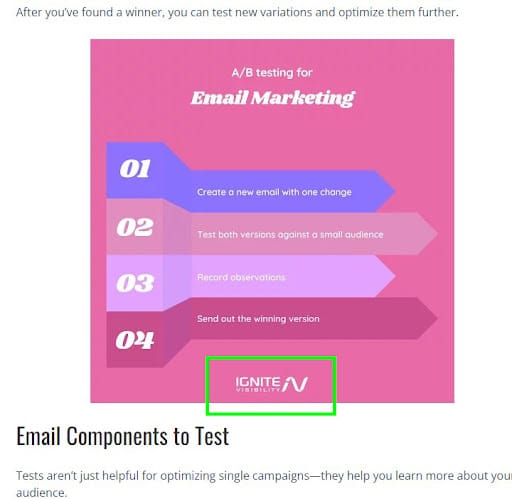
Don’t forget to add your logo somewhere on your infographic once you’re done.
Including a logo tells people that you are behind this infographic, further showing your leadership in your industry and gaining a positive reputation for your brand. Doing so will also ensure your infographics are uniquely yours and help prevent others from stealing your content and claiming it as their own.
7. Add Sources
You can cite your sources at the bottom of your infographic in a list of links or a kind of bibliography. You may also add links to sources throughout the article as you go through different points, but make sure the citing text doesn’t disrupt the flow of the surrounding content. An example of the latter could involve adding a small link beneath an image as a caption in your infographic.
Distribution Tactics
Creating your infographic is only half the battle—getting eyes on it is the other.
Here are the most effective strategies for getting your infographic seen by as many people as possible:
1. Share Your Infographic with Your Email List
If you have an existing email list, you can share your infographic with this audience first, giving these contacts “exclusive” access to the new content. These people are likely to be the most interested in your content as they’re already in your funnel.
2. Offer Your Infographic as a Download in Exchange for Contact Information
Want to use your infographic to grow your email list instead? You can turn it into downloadable content that people can get when they submit email addresses and other contact details.
3. Share It on Social Media
Have a social media audience? Share your infographic on these platforms next, which can connect with existing and new followers. People may also want to share your infographic on their own profiles, further spreading the visual and your branding.
4. Ask Other Sites to Include Your Infographic In Their Content
Once you’ve shared your post with more immediate audiences through your own channels, consider promoting your infographic with the help of others. Find relevant industry blogs or other publications and see if they’d be interested in using your infographic, which can give it a lot more exposure.
5. Create a Blog Post to Promote Your Infographic
Another great way to promote your infographic is to write a blog post around it. Explain what it’s all about and expand on certain concepts with a deeper look into the topic.
6. Include Your Infographic in a Webinar or Live Event
If you’re conducting any kind of live event, this could be the perfect time to share your infographic. It could enhance your talking points and serve as a visual aid for your audience.
7. Add It to Your Landing Pages
Another example of infographic applications is to use them in existing content. Need to refresh a blog post or landing page with newer and more compelling visuals? A recent infographic could be great to include.
Best Tools for Making and Creating Infographics
Without the right tools, creating quality infographics is impossible. Here are the best options available:
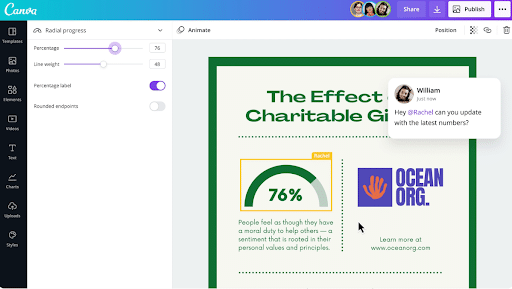
1. Canva
Canva is a web-based design tool that streamlines the entire design process. You can select and customize one of the thousands of templates.
Almost every element is customizable, and you can swap colors and fonts to get exactly the look you want. It’s also got a minimal learning curve, making it one of the best infographic design tools for any audience.
There is a premium version, but its free version is more than enough to create quality infographics.
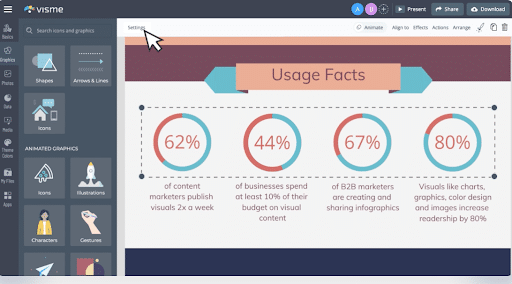
2. Visme
As with Canva, Visme is a design tool designed for both novices and advanced users to create professional visuals.
Its drag-and-drop editor makes creating graphs and other advanced elements easier than with Canva. And while it doesn’t have as many templates as Canva, there’s still plenty to choose from.
3. Adobe Express
Although Adobe has more advanced tools like Photoshop and InDesign, they designed Express for users who want to create quality designs quickly.
While Adobe Express is free, editing is more challenging than Canva and Visme.
4. Adobe InDesign
InDesign is Adobe’s flagship design tool. You can create highly detailed and complex infographics with its advanced features.
For advanced designers who don’t mind spending more time on infographics, InDesign is a great choice. However, InDesign isn’t really necessary in most cases.
Even its few features that can’t be replaced by a more streamlined tool like Canva aren’t worth the effort an InDesign graphic takes. It also has a steeper learning curve than other tools, so learning how to use all its features can be challenging.
Lastly, InDesign isn’t free. To use it outside of free trials, you’ll need an Adobe Cloud subscription.
5. Dropdeck
Another tool you can try is Dropdeck, which uses AI to help create infographics and many other types of content. If you’re not sure how to make an infographic, this resource can be a great help.
While it’s not free to use, it has a free seven-day trial before the platform bills you either monthly or annually.

Best Examples of Infographics
In the next section, we’ll show you infographics explaining complex ideas in easy-to-understand graphics. These examples will help you create infographics offering rich value to your audience.
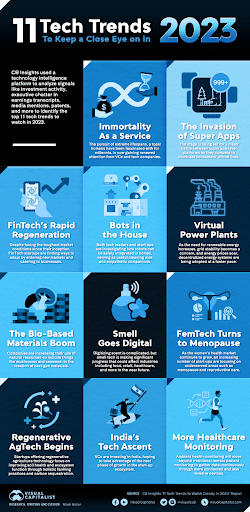
1. Tech Trends of 2023
Here is an example of an infographic design that explores industry trends in a bite-sized format. It organizes the various tech industry trends into sections with clear subheaders and visuals to match.
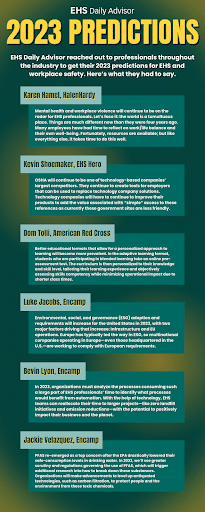
2. Workplace Safety Precautions
Another recent example of infographic design is this visual featuring predictions for workplace safety in 2023. EHS Daily Advisor asked various experts in the industry for their opinions on the matter. The infographic then organizes and compiles these responses in a clear visual.
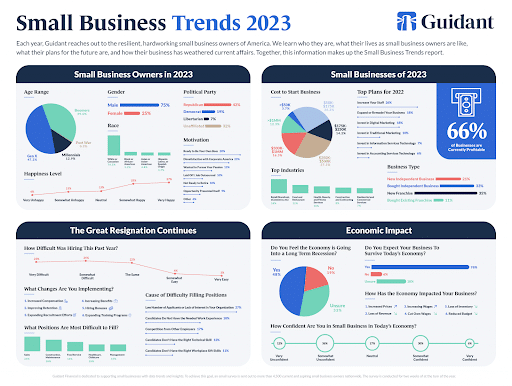
3. Small Business Trends
This is a great example of how to make an infographic that organizes data into comprehensible visuals that make the data meaningful. This visual includes pie charts and graphs that layout data and breaks it up into sections.
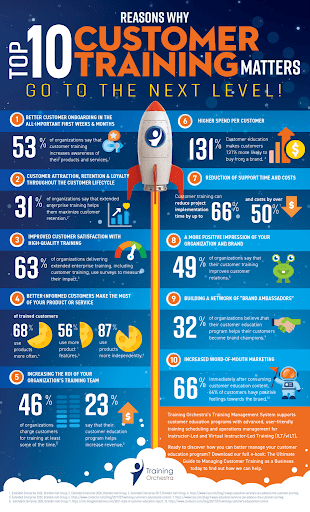
4. 10 Reasons for Customer Training
Many businesses need sufficient customer training, and this infographic does a great job of explaining why. It lists many data points that show the benefits of customer training while using engaging imagery to keep the viewer captivated. It also makes sure to list all sources cited at the bottom while including a logo for clear branding.
5. How to Jump-Start a Car
Knowing how to jump-start a car is good information for any vehicle owner to have. This infographic details just how to do so in a concise how-to guide in the form of a sleek infographic. Not only does it go through the steps, but it also includes a visual to indicate where each component is for each step.

Start Creating Valuable Infographics Now
If you want to make an infographic that really stands out and appeals to audiences, you may benefit from working with experts who have experience crafting these visuals.
Ignite Visibility can help you create high-quality and easy-to-understand infographics and many other visuals, including images and videos for marketing campaigns. Our social media marketing and other creative marketing services are ready to take your strategy to the next level.
Reach out to us today to learn more about how our services can help you get the most from your infographic designs and other content.