These social media statistics might change the way you approach social media marketing.
Here are social media statistics you need to know in 2020.
Originally published 4/20/2018, updated 4/17/2020/
What We’ll Cover:
- General social media statistics
- Facebook statistics
- Instagram statistics
- Twitter statistics
- LinkedIn statistics
- Social media statistics FAQ
To put the puzzle together, you need to understand each channel, its strengths and weaknesses, and who’s using it.
This is why I’ve put together the following social media statistics to help you inform and structure your strategy for 2018.
General Social Media Statistics
1. Almost 90% of marketers say their social marketing efforts have increased exposure for their business, and 75% say they’ve increased traffic.
In case you needed any convincing, social media is a powerful means of achieving brand awareness.
But in order to achieve optimal results, there are a few factors to consider, including:
-
- Which channels you use – this will depend entirely on your target audience, and how well you’ve identified their patterns and behaviors
- The tone of your brand – social media is a place to forge connections and bring a voice to your brand, make sure your tone is consistent and friendly, and suits the side of your business you’re trying to represent
- The content – visual, engaging content is key here. Publish relevant, quality content and involve your audience – ask questions, use polls, and host events
2. 48 percent of Americans have interacted with companies or institutions on at least one social media network.
Another big one here.
Though many may claim businesses on social media are more of a hindrance than a help, this goes to show that the majority of the population has in fact connected with a company via social media.
Notice the stat says interact. Fans are doing more than just following brands; they’re engaging with them through comments, questions, and customer service.
Which means it’s more important than ever to advertise your social media presence as a place to connect, and produce engaging content with clear CTAs.
3. 51% said that they would unfollow brands on social media if they posted irritating posts and 27% said they would mark/report the brand and page as spam and block them.

Social Media Statistics
Having a clear content strategy is key to a brand’s success on social media.
The truth is that users are all too willing to unfollow brands, meaning that everything you post must be highly targeted and highly relevant to your followers. Fluffy, filler updates simply won’t cut it.
Keeping an updated calendar and using scheduling tools like MeetEdgar can drastically help keep you on track and ensure that each post is up to snuff.
Facebook Social Media Statistics
4. Facebook still reigns supreme as the most popular social media network, and as a top search query.
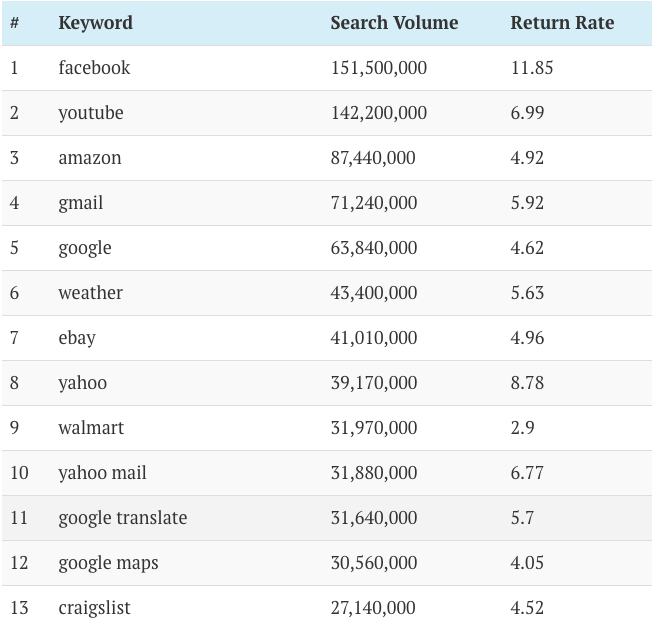
“Facebook” is the U.S’s top Google search query. Yes, that means that people are actually Googling “Facebook” at a return rate of 11.85 according to Ahrefs study. It is also #2 in the world for top searched queries, being right under YouTube. With a return rate that high, people are frequently coming back to Google and searching for the term; for reasons possibly to get to the site because they haven’t bookmarked it. Not to mention, it has a search volume of over 150 million!
5. Almost 60% of US internet users selected Facebook to watch videos online in Dec. 2017.
This is a big one for a couple reasons. First, it sheds light on one of the biggest opportunities brands have on Facebook right now: video.
For any business that hasn’t experimented with video, now is clearly the time.
The other really impressive thing about this statistic? It shows us that more and more viewers are turning to Facebook – not YouTube – to get their video fix.
Which brings me to the next stat on the list:
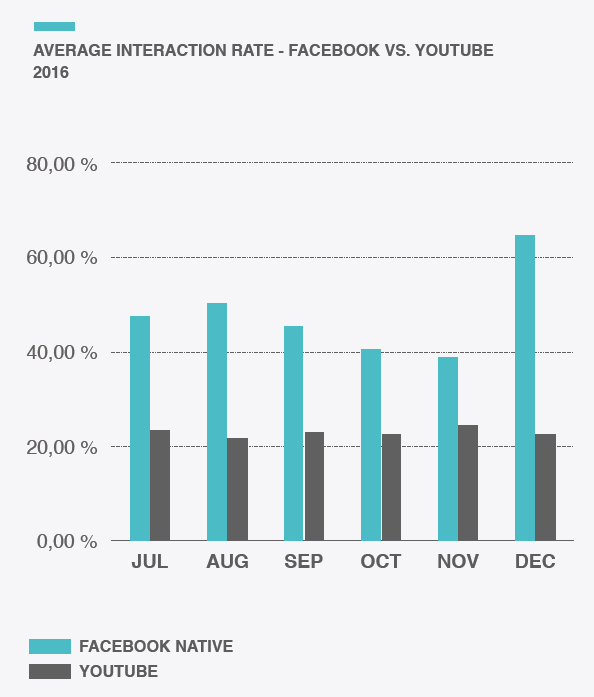
6. According to a recent study by Quintly, engagement on native Facebook videos was 109% higher than on YouTube videos.
The surest sign of social media success is a high engagement rank. And in this case, Facebook native videos beat YouTube videos by roughly 3 times.
Social Media Statistics
For marketers, it means that simply sharing YouTube videos isn’t necessarily the best way to gain and engaged audience. Instead, they need to start looking at Facebook as a video publishing platform.
Fans are turning more and more towards native formats – Facebook Live, Facebook Watch – which means to keep up with their audience, marketers will need to as well.
7. There Are More Than 300,000 Bots on Facebook
Facebook surpassed 300,000 chatbots last year. That’s up significantly from 2017, when the company announced it had reached 100,000 bots at its annual F8 conference.
Unfortunately, a company spokesperson declined to share the exact number of message bots. It’s clear, though, that many brands use chatbots to streamline customer inquiries.
In case you hadn’t heard, Chatbots are kind of a big deal. The AI-powered software can interact with customers or clients via a chat box interface, and are many companies answer to the diminishing power of traditional apps.
Chatbots come in a variety of forms and fulfill a variety of uses, including:
- News bots: inform you when major news happens
- Travel bots: deliver train or bus timetables
- Cooking bots – gives cooking tips and advice
- Banking/personal finance bots – transfers and helps manage money
- Advice bots – tell it your problems and will help with a solution
In April 2016, Facebook began to allow businesses to build their own custom bots via its Messenger platform.
And clearly, businesses have been quick to embrace it.
Interested in building in your own chatbot? Learn how here!
8. Facebook ranked second in a December 2017 survey of senior ad buyers in the US as the platform to drive the most ROI. Google Search was named No.1.
Facebook continues to be one of the most popular and effective platforms for advertising, second only to Google Search ads.
Social Media Statistics
Part of that is due to Facebook’s powerful targeting methods and ad formats. Not only that, but it’s equally effective among both B2Bs and B2Cs.
If you haven’t already set up a Facebook ad campaign (and clearly, you should), the process is pretty straightforward:
Step 1: Choose an advertising objective
Step 2: Choose an advertising target and audience
Step 3: Select your budget
Step 4: Choose your ad format
For more detailed information on setting up your Facebook ad campaign, click here.
Instagram Social Media Statistics
9. Nearly a fourth of social media influencers believe Instagram is the top avenue for influencer marketing strategies.
Influencer marketing – the process of using social media influencers to expose your brand message to their large, engaged audience – is one of the best tactics in the book.
It works because it relies on personal connections. Users develop a relationship with the influencers they follow, and therefore any recommendation or an endorsement from said influencer carries more weight and is deemed more trustworthy than that of an unknown brand.

Social Media Statistics
It isn’t about reaching the masses, it’s about reaching a very specific, targeted audience.
That said, some channels are more effective than others. As Instagram emerges as a top platform for influencers, brands will have to alter their influencer marketing strategies to focus heavily on Instagram.
10. Instagram ads grew by 28% in the second half of 2017. There were 134,000 Instagram ads in July 2017, but ultimately hit 171,000 Instagram ads in December.
Though it’s still considered one of the new kids on the social media block, Instagram has proven it’s here for the long haul.
Social Media Statistics
The last half of 2017 certainly saw an increase in ad spend as marketers invested more in the platform. Part of the increase could be due to an influx of new features over the past year, including the introduction of Instagram Stories ads, business pages, live video, and URL links.
11. Instagram Reached One Billion Users in 2018
Last year, Instagram reached a new milestone: one billion users. That’s an increase of 200 million users from September, 2017.
Instagram is the sixth most popular social media channel in the world, behind Facebook, YouTube, WhatsApp, Facebook Messenger, and WeChat.
Part of the rapid growth is attributed to the introduction of the Stories format, which lets users combine photos and videos in short, swipeable segments that disappear in 24 hours.

Social Media Statistics
For marketers, they represent an opportunity to:
- Create a fully immersive experience for users through storytelling and flexible design
- Tell complex, visual stories with minimal technical knowledge
- More easily catch user’s attention through visuals and keep them engaged
Due to their increasing popularity, marketers should focus on strategies that can be told in Story form, and consider using Instagram Stories ads.
12. Instagram drives the most engagement per post compared to any social network – 84 times more than Twitter, 54 times more than Pinterest and 10 times more than Facebook.
As far as creating an engaged audience, Instagram may be a marketers best bet.
Users on the platform are more likely to like and comment on Instagram, which gives brands a powerful opportunity to create connections. It also means that at this stage, Instagram needs to be a part of your social media strategy.
To make sure you’re getting as much engagement as possible, make sure you’re doing the following:
- Interact with your followers – respond to comments, ask questions, etc.
- Use analytics to find and duplicate your most popular posts
- Use the Stories format
- Use retargeting ads and custom audiences
- Reach out to influencers
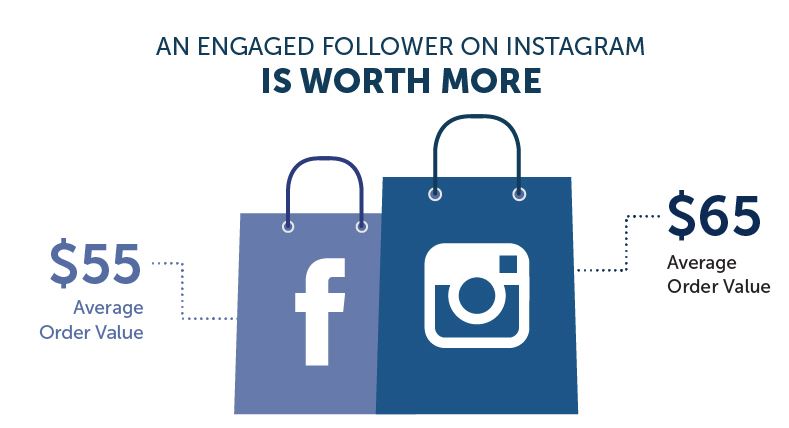
13. Engaged Instagram followers are worth more than those on Facebook, with an average order value of $65 versus $55.
Need even more reason to build an engaging Instagram strategy? If you invest in them, your followers are more likely to invest right back.
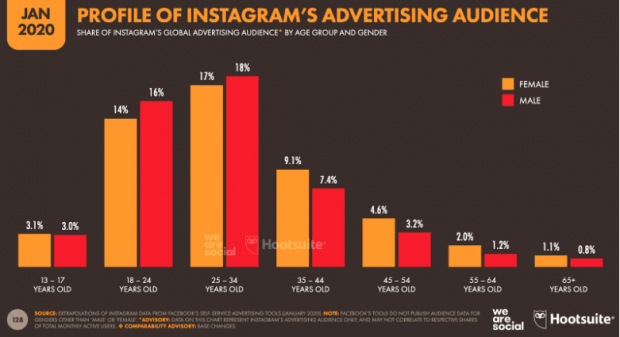
14. More than Half of Instagram Users are in the 18-34 Year Old Age Bracket
This makes Instagram the second most popular platform among teens after Snapchat. It could also be assumed, that with the rise of other viral apps Like Tik-Tok taking over the same age group, we will see these statistics shift in the next year or so.
Twitter Social Media Statistics
15. Twitter ranked last as a platform to drive ROI in a December 2017 survey of US senior ad buyers.
That’s bad news for Twitter, but important for marketers.
Social Media Statistics
As platforms like Facebook and Instagram grow in terms of advertising results, Twitter’s taken a back seat.
Now, advertisers would do best to focus their ad spend elsewhere, and use Twitter for more direct response, customer queries.
16. 47% of marketers agreed Twitter was the best social media channel for customer engagement.
Twitter still has its uses for marketers, especially those looking to engage directly with customers.
Due to its real-time feed and updates, Twitter’s proven to be the top channel for customer service, allowing customers to easily and quickly contact brands.

Social Media Statistics
But in order to use it effectively, brands must stay on top of their Twitter feed through established customer service processes and quick responses.
It’s also an ideal platform to publish product updates and announcements. For each one, think of different spins on the same update to produce the multiple tweets.

Social Media Statistics
17. Tweets with images are 150% more likely to get Retweets than text-only Tweets.
Really, this one works across the board.
Regardless of the platform, visual content tends to see higher engagement than text only posts and updates.
While this doesn’t mean that every post has to contain an image, it does mean that image creation needs to be a part of your strategy and incorporated in as many posts as possible.
Keep in mind that tools like Canva and Picmonkey allow you to easily create images for each platform.
18. Total annual revenue for 2017 was $2.4 billion, a decrease of 3% year-over-year.
This stat echoes that Twitter is losing its standing in the social media world, and no longer commands the audience and revenue it once did.
While it’s still a valuable channel to include in your social strategy, make sure you are using it strategically to forge customer connections and not relying on it for advertising or influencers, which would be better focused elsewhere.
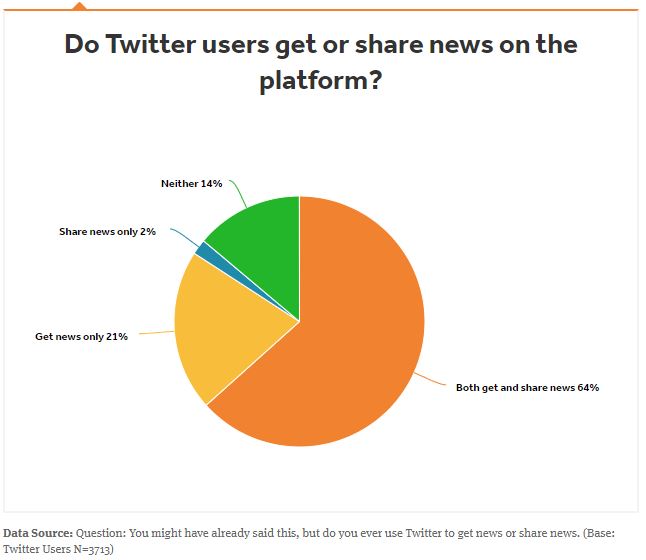
19. 86% of Twitter users say they use the site for news, and 70 percent say that they do so because it’s a great way to get news in real time.
This is another important stat to keep in mind as you develop a Twitter strategy.
Social Media Statistics
When it comes to Twitter, focus on publishing posts that contain any breaking news in your industry.
While those businesses that publish news and current events will have an obvious advantage here, others can still use Twitter to their advantage by capitalizing on any trending topics, and developing posts around them.
LinkedIn Social Media Statistics
20. The typical LinkedIn user only uses the network for an average of 17 minutes per month.
That’s not a lot of time to work with, especially compared to other popular networks.
For marketers, it means the old rule is more vital than ever: quality over quantity.
While you don’t have to produce the volume of posts required for a successful Twitter or Facebook campaign, you do have to focus on making sure each post contains highly relevant, targeted information.
Users come to LinkedIn for information and expertise, and it’s the ideal platform to establish yourself as an expert in your industry.

Social Media Statistics
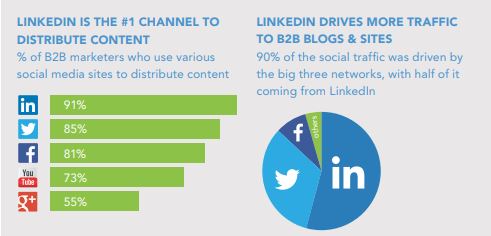
21. 94% B2B organizations rely on LinkedIn for content marketing and distribution.
This one’s no secret: LinkedIn is the social network for B2Bs.
Because most platforms cater more to a B2C crowd, LinkedIn is by far the best option to reach professionals and recruiters.
To form an effective LinkedIn content marketing strategy, focus on status updates with links to relevant articles or websites and include mentions when possible.
Also put an emphasis on producing long form content for its publishing platform. For tips on what to write, check out this list from LinkedIn.
Remember, LinkedIn isn’t the place for idol updates or product pitches, and is best used during normal business hours.
22. LinkedIn drives more than half of all social traffic to B2B blogs and sites.
The great thing about LinkedIn is that its users are there for a clear purpose.
Social Media Statistics
They’re not looking for mindless social chatter or quizzes to gain their attention; instead, they’re actively looking for relevant articles and content to better their business. And if they find a post that fits the bill, they’re likely to track it back to the source.
Make sure your profile is optimized with links to your website, blogs, or any other sites you’ve published for. Also include links to blog posts and longer articles in your status updates, and a link back to your site in any long-form content published on the site.
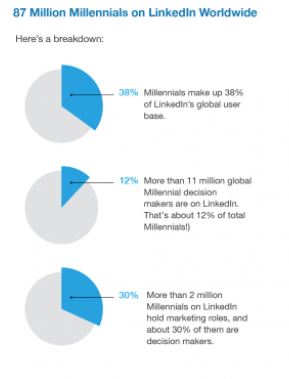
23. Of the 2 billion Millennials globally, 87 million of them are on LinkedIn.
Social Media Statistics
This one may surprise you.
Millennials don’t exactly spring to mind when you think of LinkedIn’s, but according to data from LinkedIn, they actually make up a big chunk of the platform’s audience.
One way or the other, millennials will someday be the ones making the decisions. And that’s something marketers can’t afford to ignore.
Make sure your LinkedIn strategy makes room for millennials and actively seek and publish content relevant to the demographic.
It also means that you don’t have to rely on newer social trends like Snapchat to catch Millennials attention
24. Of those 87 million Millennial users, 11 million are in decision-making positions.
This is another cool one.
Not only are Millennials a secret stronghold on LinkedIn, they’re sitting in powerful positions.
11 million are in decision-making roles, meaning they have the power to make key purchasing decisions. This only further proves how important it is to take the younger generation into account when strategizing for LinkedIn.
25. LinkedIn Has More Than 600 Million Users
LinkedIn is the largest online business network in the world with more than 562 million users.
Those users are located in more than 200 countries and territories around the world.
26. The Importance of Referrals and Recommendations
Studies show that 80% of consumers made a transaction resulting from a recommendation from someone they know personally.
Trust, rapport, and familiarity all play an important role in making sales.
27. The Average LinkedIn User has 930 Connections
There is power in numbers and if you have the ability to network and do proper outreach you can achieve a great deal as a result.
28. Create an Online Presence
Research shows that 97% of consumers go online to find out more information about a product or service they are interested in.
This demonstrates how imperative it is to have a big online identity.
29. Publish Content
3 to 5 pieces of content. That is how much content is viewed, normally, before 47% of consumers will make contact with a business.
30. Stay Off of the Phones
Only .3% of cold calls result in an appointment being made.
Use your time effectively and to create high traffic and revenue.
Social Media Statistics FAQ
1. Social Media Statistic: What Percentage of the World Population Is on Social Media?
There are about 3.8 billion people worldwide on social media According to the Digital 2020 study.
The world population is roughly 8 billion. So that means some 50% of all human beings alive are on social media.
2. Social Media Statistic: What Percentage of the U.S. Population Is on Social Media?
According to the latest social media statistics, approximately 80% of the U.S. population has a social media account. That amounts to about 247 million people as of 2019.
Also, Pew Research did a study showing that Americans are less likely to use social media as they get older. According to that research, 90% of 18 to 29-year-olds have a social media account. But that percentage drops as respondents advanced in age.
The same study showed that social media usage is highest in suburban America.
3. Social Media Statistic: How Much Time Do People Spend on Social Media Over Their Lifetimes?
According to the Digital 2020 study, the average internet users now spends 6 hours and 43 minutes online each day. 50.1% of those users are on mobile.
That breaks down as follows:
- 1 year, 10 months on YouTube
- 1 year, 7 months on Facebook
- 1 year, 2 months on Snapchat
- 8 months on Instagram
- 18 days on Twitter
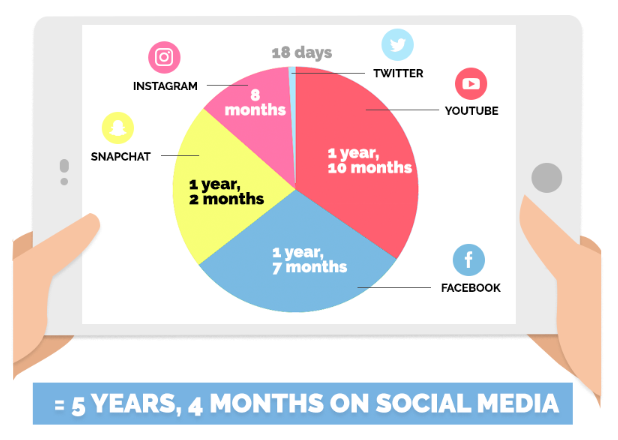
Social media statistics: how much people spend on social media in a lifetime
By comparison, people spend 7 years, 8 months watching TV throughout their lives. Eating and drinking takes up about 3 years, 5 months and socializing (the old-fashioned way) takes up about 1 year, 3 months.
Here’s the average daily breakdown for each social media channel:
- 40 minutes on YouTube
- 35 minutes on Facebook
- 25 minutes on Snapchat
- 15 minutes on Instagram
- 1 minute on Twitter
The same study showed that the number of people using social media is increasing as is the amount of time people are spending on social media.
- Millennials are social – use your account to form and maintain relationships
- Timing – instead of the standard business hours, 35 percent of the millennial audience tends to consume content between 8:00 p.m. and 11:00 p.m
- Prepare content for those on-the-go – think infographics, videos and podcasts
4. How Do I Get Social Media Statistics?
If you want social media stats for one of your own accounts, you should check your analytics engagement metrics. There, you’ll find info about engagements and the number of people who viewed your posts.
If you’re looking for social media statistics for all users, your best bet is to head over to Statista and search for the name of the social media channel you’re following.
You’ll find a wealth of stats specific to all social media channels on that site.
5. Which Social Media Statistics Should I Track?
The answer to that question really depends on the nature of your business.
If you’re running an ecommerce site, for example, you’ll want to track the number of people who click on product ad links to visit your site.
On the other hand, if you’re using social media to market yourself as an expert in your field, you’ll more likely want to track people who share your posts.
Almost always, though, you should track engagement. That’s how you know people are paying attention to your content.
6. Are There Social Media Statistics Tools?
Yes, there are plenty of social media statistics tools. Here are some of the best:
- Iconosquare – Offers Instagram analytics.
- Buzzsumo – Shows how content from your website performs on social media.
- Tailwind – Gives you Pinterest metrics.
- Sprout Social – Helps you manage your social media accounts in addition to offering plenty of analytics.
- SumAll – Shares cross-channel social media performance.
- Cyfe – Displays not just social media analytics, but marketing, sales, and web analytics as well.
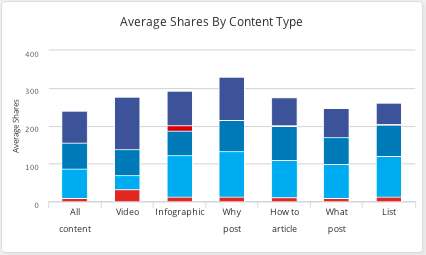
Tools like Buzzsumo will help you monitor your content and social media statistics
Wrapping Up Social Media Statistics
If there’s one thing you take away from this post, let it be that social media remains as important as ever when it comes to marketing.
The channels you use and the content you produce for each will vary by industry and audience. But across the board, an emphasis on engaging content, quick responses and a willingness to invest in advertisements will ultimately help you win in 2018.
