How would you like to conduct a quick SEO audit with a tool that’s built into your Chrome browser? You can do that with the Lighthouse extension.
If you’re not familiar with Lighthouse, it’s an open-source utility that professionals use to check the health of their websites. It analyzes everything from performance to accessibility to best-practices.
Lighthouse Chrome Extension
The tool lives up to its name: it keeps you from “crashing on the rocks.”
However, in the past, you needed to run Lighthouse on the command line of an operating system or as a Node module. Now, you can launch it within your browser.
In this article, we’ll go over the Lighthouse Chrome extension, explain how to install it, and show you how to use it.
Installing the Lighthouse Chrome Extension
Before you can use the Lighthouse Chrome extension, you have to install it in your browser. Fortunately, that’s easy to do.
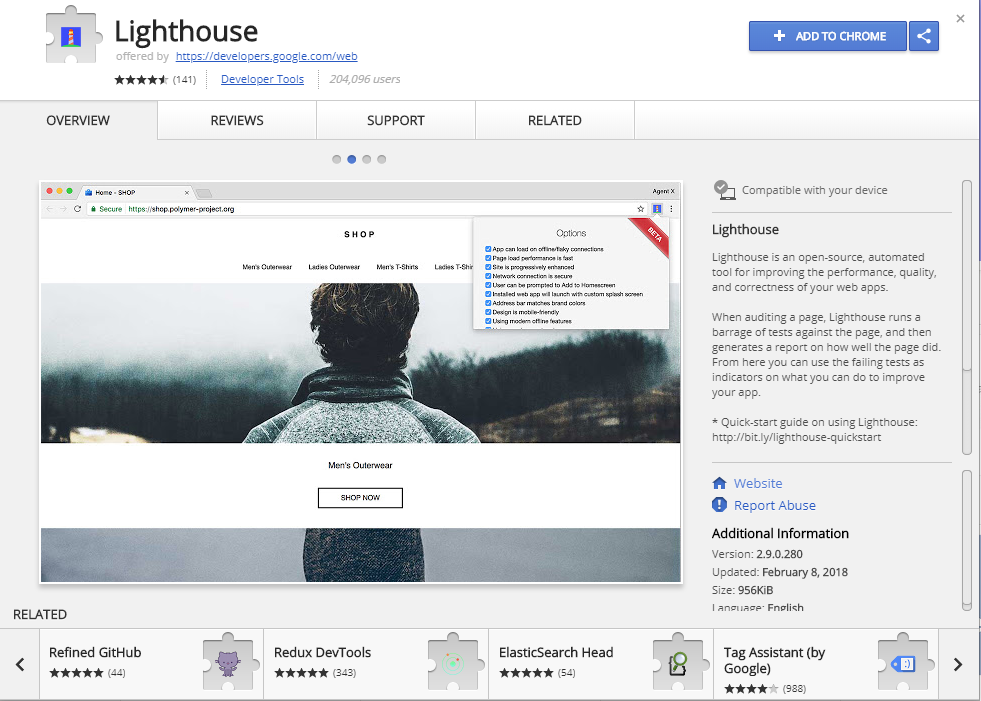
First, visit the extension page. If it appears in a separate window and looks like a pop-up, that’s fine.
In the upper, right-hand corner, you should see a button that says “Add to Chrome” or words to that effect. Click that button.
You’ll see a confirmation pop-up asking if you want to install the Lighthouse extension. Click “Add extension.”
Lighthouse Chrome Extension
After some processing time, you should see a message in the upper, right-hand corner that the extension has been added to your Chrome browser. Close that pop-up.
In the upper, right-hand corner of the browser, next to the bar where you type in a URL, you should see the Lighthouse icon. That means you have successfully installed the extension.
Running Your First Lighthouse Report
Now that you’ve installed the Lighthouse Chrome extension, it’s time to run your first report. Before you can do that, though, you need to head over to the website you want to audit.
Since it’s usually helpful to learn by example, we’ll audit the SEMRush homepage in this tutorial. Open that page in a separate tab.
Next, click on the Lighthouse icon in the upper, right-hand corner of the screen. A pop-up will appear.
In the middle of the pop-up, you’ll see the name of the extension (Lighthouse). Just below that, you’ll see the URL of the page that you’re about to evaluate. It should be “https://www.semrush.com”.
At the bottom of the pop-up, you’ll see two buttons: “Options” and “Generate Report.” Click the “Options” button to look at some of your options.
As you can see, you can choose from five different audit categories:
- Performance – checks how quickly the page loads
- Progressive Web App – checks PWA qualities such as responsiveness and 3G speed
- Accessibility – checks website friendliness for non-typical users (such as those who are color-blind)
- Best Practices – checks for web application development best practices
- SEO – checks that the page is optimized to perform well in the search engine results pages (SERPs)
For now, leave all the boxes checked so that you can get a full readout of the site’s health.
Click “OK” on the “Audit categories to include” popup. Then, click “Generate report.”
After a few minutes, the report will appear in a separate browser window.
If you look at the top, you’ll see numerical scores for each audit category that you just selected:

Lighthouse Chrome Extension
- Performance – 83
- Progressive Web App – 55
- Accessibility – 40
- Best Practices – 81
- SEO – 80
Your numbers may vary slightly. Also, by the time that you’re reading this, SEMRush might have changed its homepage so that it gets different scores.
Those scores are numbers from 0 – 100, with 100 being the best. As you can see, low scores get a red color, medium scores get a yellow color, and high scores get a green color. That follows that pattern that you’ll see on other tools, such as PageSpeed Insights.
SEMRush is looking good in terms of Performance, SEO, and Best Practices. However, the site could use some work when it comes to its Progressive Web App score. It needs to improve in terms of Accessibility.
Let’s look at each section of the report next.
Performance Reports on Lighthouse Chrome
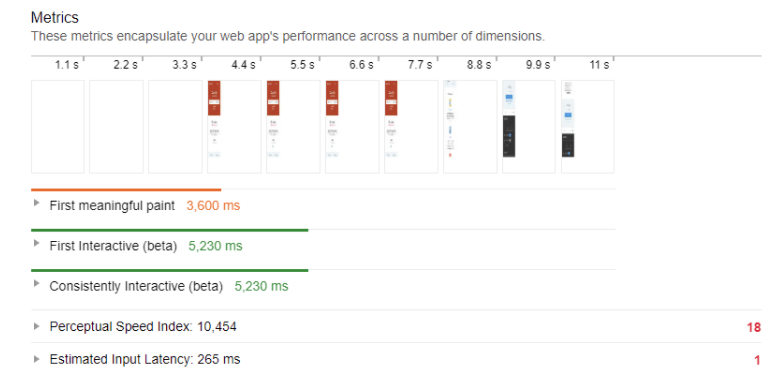
In the Performance section, you’ll see a timeline at the top. That timeline shows you how long it takes the page to load.
As you can see, the extension actually “draws” a thumbnail version of the website at the point where it loads. In this case, that’s at about the 2.6-second mark.
Below the timeline, you’ll see some key metrics. The First Meaningful Paint stat shows you how long it takes the page to load. The Perceptual Speed Index shows you how quickly the contents of the page are visibly populated. The Estimated Latency shows you how long it takes the website to respond to user input.
Lighthouse Chrome Extension
Below the stats, Lighthouse shows some opportunities for improvement. For example, it looks like the render-blocking stylesheets are adding about 700ms – 800ms in page load time. That’s more than half a second.
Lighthouse is also complaining about offscreen images, legacy image formats, and unused CSS rules. Those violations, combined, add up to about 410ms in page load time or almost half a second.
So right off the bat, you can see that if SEMRush took care of those problems, the site could trim more than a second off its load time. Users would be delighted with that.
Below the Opportunities section is the Diagnostics section. That gives you details about the Critical Request Chains. Use that info to find bottlenecks in the page load.
Finally, Lighthouse will also show you info about the stuff the website is doing right. That’s in the Passed Audits section.
Progressive Web App Reports -Lighthouse
A progressive web app uses modern technology to deliver a rich user experience within the browser. You would think that a popular tool like SEMRush would score well in that category.
Unfortunately, it doesn’t.
Lighthouse Chrome Extension
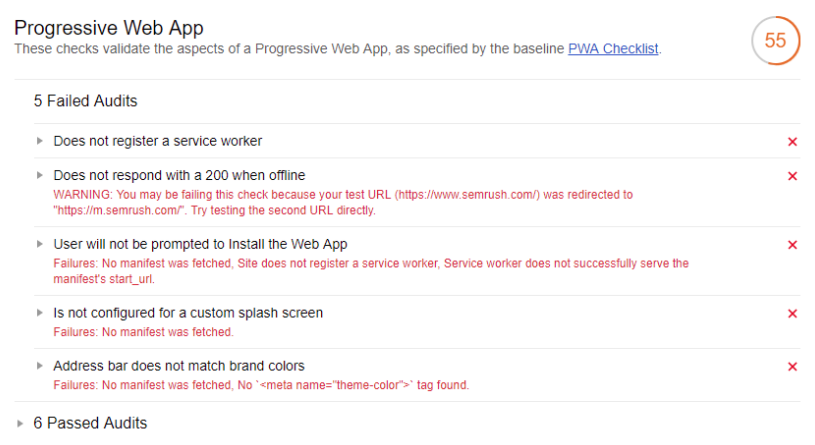
Why? Because it failed four important audits:
- It doesn’t register a service worker that enables PWA features, such as push notifications
- It doesn’t prompt users to add the app to their home screen
- It’s not configured for a custom splash screen
- The address bar isn’t customized to match theme colors
There’s another failure: “Does not respond with a 200 when offline.” That’s probably a false read, though, because the URL was redirected (from https://www.semrush.com to https://m.semrush.com).
Below the list of complaints, Lighthouse once again shows you everything that SEMRush is doing correctly. In this case, the app shows content when JavaScript isn’t available, loads the page quickly on 3G, and uses the meta viewport tag for responsive design.
Finally, Lighthouse shows you a list of things you need to check manually:
- Cross-browser compliance
- Smooth transitions from page to page
- Unique URLs for all pages
Lighthouse Tests the Accessibility if Your Site
Not everybody fits the profile of an average user. That’s why it’s important to ensure that web apps work for people who may have poor vision or suffer from some other impairment.
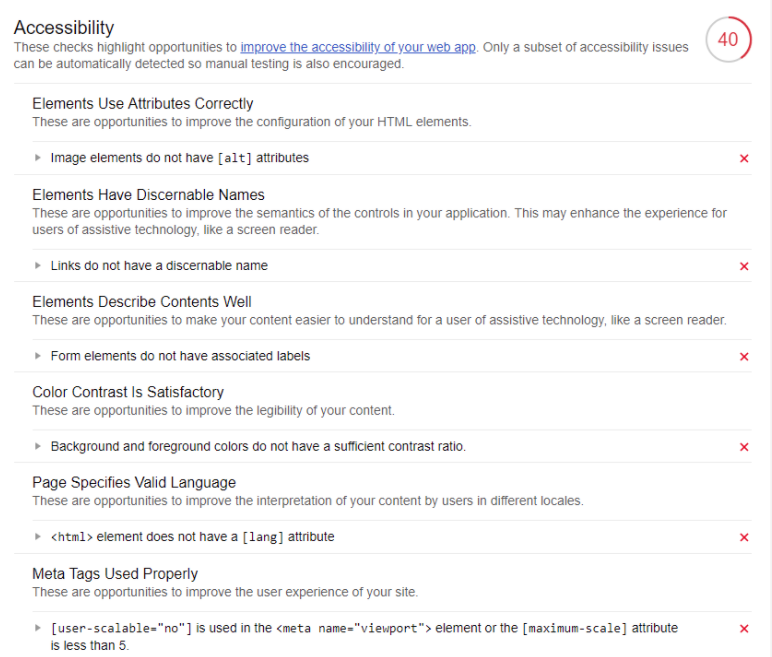
The Accessibility audit category checks the website to ensure that people with special needs can use it. This is another area where SEMRush could use some improvement.
There are several reasons why one of the most popular tools used by digital marketers scored so low on Accessibility:
Lighthouse Chrome Extension
- There are image elements with no “alt” attributes
- There are links with no discernable names
- There are form elements with no associated labels
- The background and foreground colors don’t contrast well enough
- The HTML element doesn’t have a “lang” attribute
However, SEMRush did get a few things right as well:
- There are elements with discernable names
- The elements describe the content well
- The elements are well-structured
Once again, at the very bottom Lighthouse will tell you things that you need to check manually, such as the tab order on the page, proper labeling of custom controls, and the visual order on the page.
Best Practices Lighthouse Chrome Extension
The Best Practices section will show you what the website is doing right and wrong from a development standpoint.
At the very top, you’ll see the failed audits. SEMRush has three of them:
- Uses HTTP v1.1 for some resources instead of HTTP v2.2
- Doesn’t use passive listeners to improve scroll performance
- The app’s short_name is longer than 12 characters
Those are the only three failing points. That’s why SEMRush got a high score in this category.
SEMRush also got a lot of things right. There are 13 passed audits, such as:
- Uses HTTPS
- Avoids document.write()
- Avoids deprecated APIs
If you run the Best Practices audit against your site and see some failures, it’s important to contact your development team. Most of those problems are way too challenging for somebody who’s not an expert in web application development.
Check on the Health of Your SEO with Lighthouse
Finally, the SEO category shows the health of the website from an SEO perspective. This is another area where SEMRush received a great score.
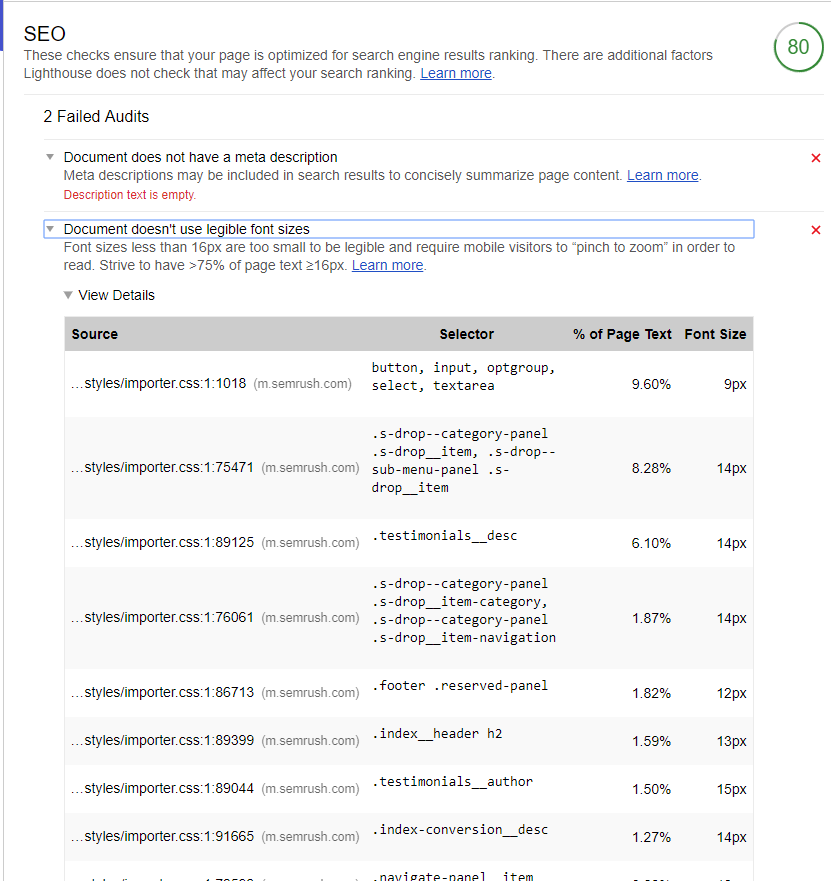
That’s because there are only two failed audits:
Lighthouse Chrome Extension
- Document does not have a meta description
- Document doesn’t use legible font sizes
Those are both easily fixable, so SEMRush could get an even better score in terms of SEO.
The app also passed several checks, including:
- Document has a <title> element
- Page has a successful HTTP status code
- Page isn’t blocked from index with robots.txt
If you run the SEO report on your website and see audit failures, you might be able to take care of them on your own. Still, it’s probably a good idea to ping your development team.
Wrapping It Up Lighthouse Chrome Extension
Lighthouse was just released. That means that Google will most likely add to its feature set over time.
So even though the extension seems pretty light (especially as compared to more sophisticated tools like Screaming Frog), it’s just in its infant stages at this point. Look for it to conduct a more robust analysis of your website at some point in the future.
Until then, it’s a great extension to have in your browser so you can audit any site with just a couple of clicks.