Data drives nearly every critical process in your business.
To ensure your organization runs smoothly, you need to run an analytics audit regularly.
And since your reporting is only as good as the data you’re collecting, we’ve put together a checklist to help you accurately forecast marketing initiatives and maintain good data integrity.
Sessions on Primary Domain
If you receive more traffic on other domains and not on your own, this could be an indication of a possible SPAM and/or implementation issue. A cross-(sub) domain implementation is the only exception to this. The goal is to have the percentage of sessions on your primary domain exceed 99%. If this isn’t the case, then try creating an “include” by hostname filter, so you are only including what you expect to see.
Sampling
Sampling occurs at 500k sessions at the property level within the specified date range you are using. If you have more sessions than that in one month, then you’ll likely encounter some sampling problems.
Most companies come across this issue if they’re using custom data via Google Analytics segments. Another option to consider when dealing with sampling is Google Analytics 360, which features more robust capabilities ideal for larger businesses.
PPC Sessions in Organic
Whenever you see specific query parameters show up as part of the landing page of Organic Search, this is an indication of PPC sessions appearing in Organic Search in Google Analytics. To avoid this, be sure to tag all your paid search campaigns appropriately. For example, you don’t want your Yahoo! paid search campaigns to be displayed as organic traffic in Google Analytics.
Query Parameters
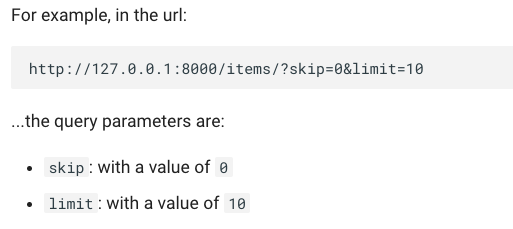
Only keep query parameters in the URL if they deliver real value for your analysis. But make sure to eliminate “technical” query parameters since they can have a negative impact on your audit data analytics process. You can check this by verifying whether the percentage of page views that include query parameters is less than 5%.
(Not Set)
This is a placeholder name that Google Analytics uses when it doesn’t have information on the specific dimension you selected. A (not set) percentage higher than 2% on one dimension suggests a potential implementation and/or configuration miscalculation in Google Analytics.
Bounce Rate
This metric needs to be reviewed in context. Landing pages with more than 100 entrances and extremely high or low bounce rates could mean that there are possible implementation issues. To see if you pass the bounce rate test, check if there are pages measured with an average bounce rate of below 5% or higher than 95%.
Personally Identifiable Information (PII)
Users are not allowed to send PII to Google Analytics. Doing so can result in your Google Analytics account being terminated. To avoid running into potential PII collection issues, look for PII during the setup and testing phase of your Google Analytics implementation. This check scans PII information across your page URLs.
Self-Referrals
If your own domain shows up as a referral, this indicates a potential tracking issue on your site and could compromise your data integrity. However if your percentage of self-referrals is less than 1%, you shouldn’t have any problems.
Custom Campaign Tracking
The default mediums in Google Analytics include direct traffic, referrals, organic traffic, and Google AdWords traffic.
However, there should be additional mediums present in your account. Setting up custom campaign tracking for additional traffic sources in Google Analytics is a vital part of collecting accurate and relevant information.
Mediums with Low Traffic
A higher percentage (ie. 30%, 50%, 100%) of low traffic mediums signifies an inadequate setup of custom campaign tracking in Google Analytics. If the percentage of mediums receives less than 1% of total traffic less than 20%, you may have to refine your strategy.
Social Referrals
Social traffic is not measured as a separate medium on Google Analytics. We recommend rewriting referral traffic into social traffic and creating an entirely separate bucket for this group.
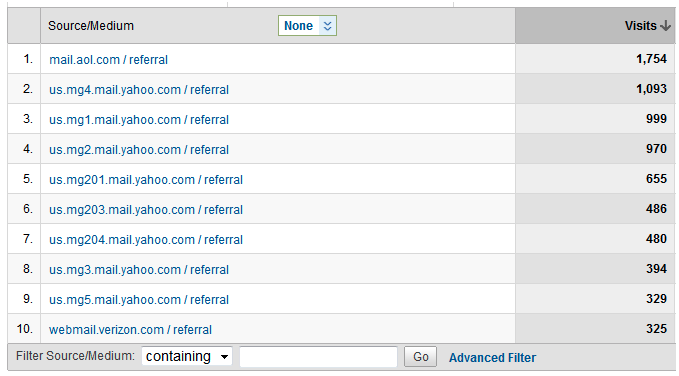
Email Referrals
Higher volumes of email referrals could mean that there are inconsistencies in your email link tracking.
It can also result in higher numbers of direct traffic. If your email referrals don’t show up within your referral medium data, then there’s no further action needed on your part.
AdWords Integration
Incorrectly measuring Google AdWords clicks in your Google Analytics account could result in an inaccurate integration of both Google AdWords and Google Analytics.
AdWords Discrepancies
Usually, the number of Google AdWords clicks isn’t equal to the number of Google Analytics sessions. If you do find that there are larger differences, this could mean there is something wrong with your Google AdWords tracking and/or Google Analytics implementation.
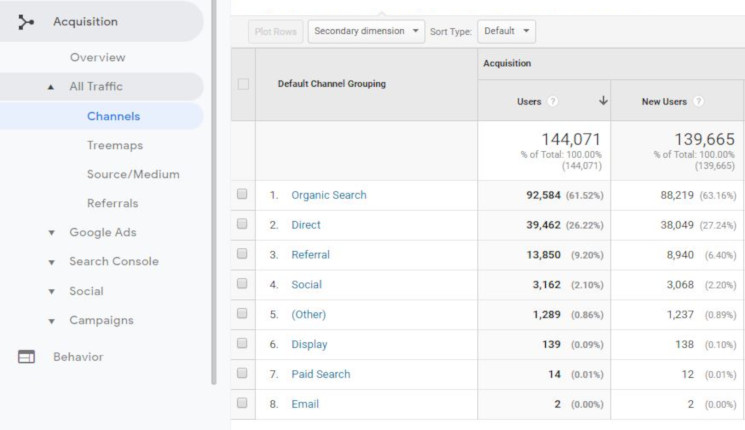
(Other) Channel Group
The higher the percentage of the “Other” channel group, the harder it is to assess and optimize your traffic channels. If the percentage of sessions in the “Other” channel is more than 2%, then your data will be rendered inaccurate, causing a variety of interpretation issues.
Direct Traffic
Direct traffic is typically the result of a user entering the URL into their browser to directly access your site. In this case, there’s no referring website linking one website to the other. But, a higher percentage of direct traffic sessions indicate a possible measurement-related issue.
Branded Paid Search Traffic
Separating your Branded Paid Search and Generic Paid Search will unlock new insights and boost your optimization potential. Ideally, you want Branded Paid Search to be found within your default channel report as a channel. Please note that this metric is only applicable for those running Paid Search campaigns.
Site Search
Without having Site Search functionality on your website, there is plenty you could be missing out on. The Google Analytics reports contain tons of business insights you can leverage to further enhance your traffic channels and improve your data integrity.
Demographics Data
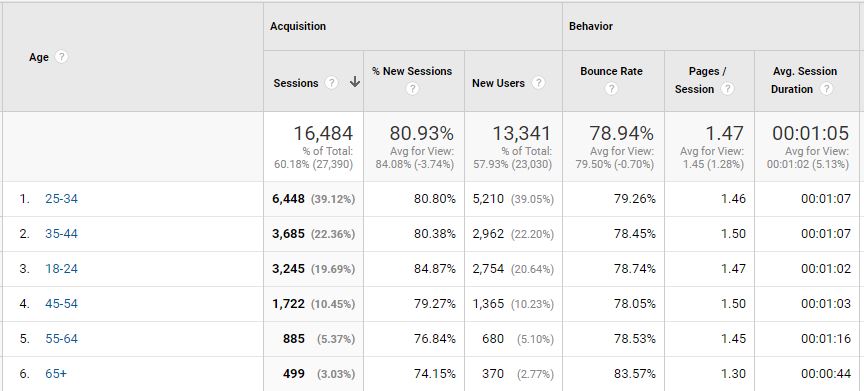
Demographics Data, like age, and income, can significantly enrich your data so that you draw better insights from your audience and adjust accordingly. Therefore, it should be stored in your Google Analytics view.

Age demographics in Google Analytics
Content Grouping
If you’re looking to get the most out of your website, content optimization is key. You can easily group content into a logical, cohesive structure that accurately reflects how you think about your website. There should be at least one content grouping configured and retrieving data.
Events
Event tracking is a feature you should always put into action. Its purpose is to measure and optimize on significant interactions, in addition to the standard page views. You’re making the right moves if your event data is present in the Google Analytics view.
Custom Dimensions
While Google lets you segment and filter on 100+ pre-configured dimensions, Custom Dimensions can enrich your data tremendously as it lets you sync external data with your Google Analytics data. In a Google Analytics standard account, there are 20 custom dimension slots and 200 slots in a Google Analytics 360 account. Keep in mind that you cannot delete custom dimensions once you create them. But, it is possible to temporarily disable your custom dimensions, which could prove to be useful during the implementation phase.
Custom Metrics
With Custom Metrics, you can generate additional insights you can’t get from your standard data set. According to Google, “Custom Metrics are like default metrics in your Analytics account, except you create them yourself. You can use them to collect and analyze data that Google Analytics doesn’t automatically track.” Similar to Custom Dimensions, Google only permits 20 Custom Metrics for free accounts and 200 for premium accounts.
Goals
Setting up goals is one of the most important actions you could take in Google Analytics. Make sure to set up both micro and macro goals on your website. An example of a micro goal would be watching a demo or downloading a white paper, while with a macro goal, the aim is to get the user to convert and make a purchase. You could also set converting leads from third-party data as a goal, in which case you would need to leverage resources like lead411’s data services for the best-quality leads. You can set up 20 goals per Google Analytics view. Make sure to have at least three active, relevant goals per view. Also, ensure that the goals you set are reasonable and attainable.
Goal and/or E-commerce Value
We encourage setting up goal or e-commerce value tracking. Both goals will provide you with valuable insight into how your business is performing. You might use goals for destination pages, time on site tracking, event tracking, or pages per visit tracking. E-commerce, conversely, is often used for measuring e-commerce-related metrics like transactions per visit, transaction revenue, and item quantity. However, in most cases, you should choose between goal and e-commerce values, instead of including both in the same view. That way, you can prevent having duplicate measurements in associated metrics.
Final Thoughts
Remember—to produce accurate forecasts, you need accurate data. This is where running an analytics audit for data integrity comes in handy.
Following this checklist closely will ensure that your data is reliable enough to inform your decision-making process.
And be sure to check out Ignite Visibility CEO John Lincoln’s best-seller, “The Forecaster Method” to learn all the different ways your marketing channels can yield the best results for your business.


