Wondering what ROAS is?
If you’re in charge of advertising for your brand or ecommerce site, it’s an acronym you need to be very familiar with.
In this article, I’ll cover the concept of ROAS in-depth and give you some insight as to how to calculate it for your brand to make the most of your ad spend.
What We’ll Cover:
What Is ROAS?
ROAS stands for “Return on Ad Spend.” As the full name implies, it tells you how much money you’re earning as a result of the amount you spend on advertising.
Here’s how to calculate ROAS: divide the total revenue you earned from advertising by the amount you spend on advertising:
ROAS = Revenue Earned From Advertising / Advertising Expense
For example, if you spend $2,000 on Google Ads and earned $4,000 from people who clicked on those ads, then your ROAS is $4,000 / $2,000 or 2. In accounting terms, that 2 means 200%.
Isn’t That ROI?
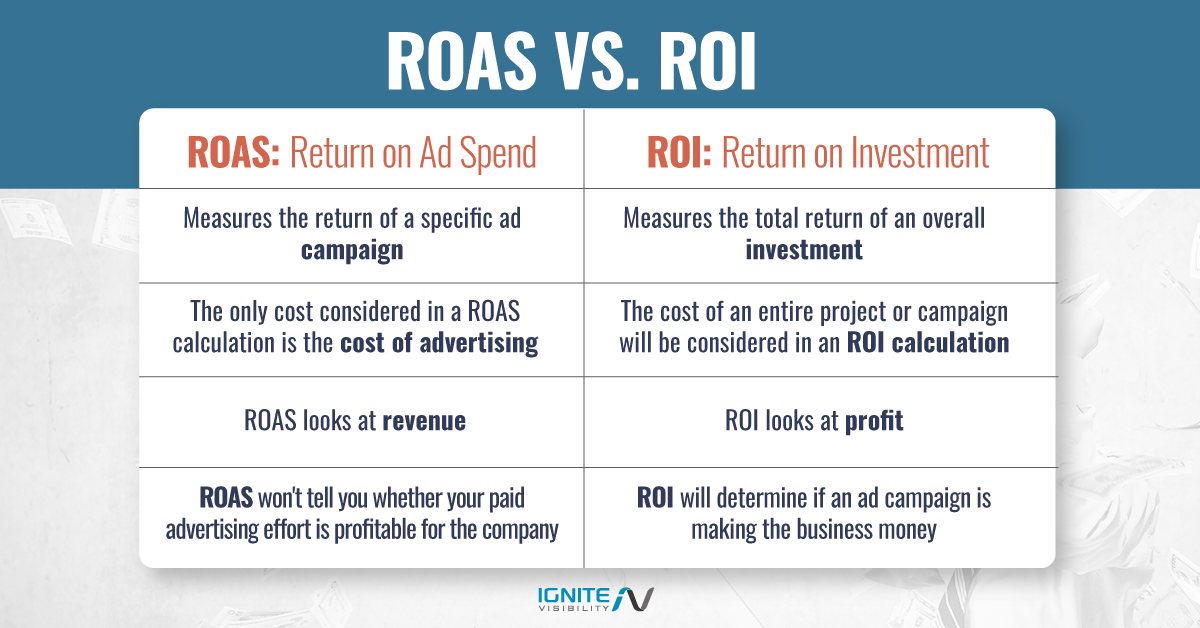
No. ROAS is not the same thing as return on investment (ROI).
That’s because ROI is a measurement of strategic investment while ROAS is a measure of tactical spend.
In business, strategy usually refers to long-term objectives while tactics usually refer to short-term objectives.
ROAS is more of a short-term measurement while ROI is long-term measurement.
ROAS vs ROI
Also, the ROI formula is different:
ROI = (Gain From Investment – Cost Of Investment) / Cost of Investment
For example, if you spent $100,000 on online marketing last year and earned $150,000 from your marketing, then your ROI is ($150,000 – $100,000) / $100,000 or .5. In accounting terms, that’s 50%.
What Is a “Good” ROAS?
That’s a little like asking “how long is a piece of string?” A “good” ROAS for your business model or industry might be different from the overall average.
If you’re running a business that’s marketing a cash cow with high margins, you ought to have a very high ROAS. If not, you probably need to improve your landing page or hire a pay-per-click agency.
On the other hand, if you’re running a business in a competitive industry with low margins, then you’ll likely have a lower ROAS.
Return on Ad Spend
Keep in mind: the formula for ROAS is derived from your conversion rate. Since you only earn revenue when people make the purchase, that’s the number you should really be looking at.
What’s a good conversion rate? Again, your mileage might vary. However, there are some channel-related benchmarks.
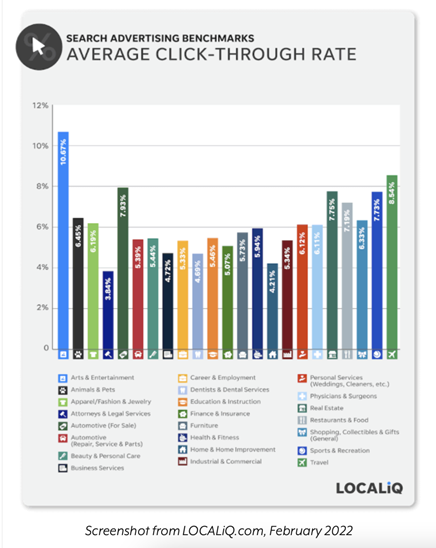
- For Google Ads accounts, the average conversion rate is 3.17%
- For industries with the lowest average conversion rates of all Google Ads accounts, the conversion rate is 1.35%
- For industries with the highest average conversion rates of all Google Ads accounts, the conversion rate is 10.67%
As you can see, there’s a wide diversion. That’s no doubt due to the fact that marketers at the top know how to reach exactly the right people using Google Ads.
If you find that you’re hitting a great conversion rate and yet you’re still not generating a positive ROAS (that’s anything higher than 1 or 100%), then that usually means one of two things: you’re spending too much on advertising or you’re not charging enough for your product.
If you find that your product is priced competitively and you’re not offering any additional value over others in your industry, then you can probably eliminate the possibility that you’re not charging enough.
Of course, if you’re selling the same thing as everybody else at the same price, then it’s likely you’re offering something on the downside of the product cycle and that could be the problem in and of itself.
On the other hand, you might just be spending too much on pay-per-click advertising. To determine that, take a look at your targeting practices.
Are you advertising only to people in your market? Have you segmented your market and run ads to people in specific segments? If you’re using search marketing, have you added negative keywords to ensure you don’t attract people who aren’t in your market?
Keep in mind also that many online ad services operate on a bid model. That is, you bid a certain amount for a click or an impression.
If you haven’t optimized your campaigns for just the right bid, then you could be spending too much on pay -per click advertising. That will affect your ROAS.
Of course, there are other factors that go into online ad spend. We’ll cover those in the next section.
How to Calculate ROAS and Ad Spend
You might think that a business calculates ad spend by just adding up the total dollars spent on advertising as reported by various online ad services.
If only it were that easy.
Fortunately, those services do make it easy to calculate the cost of clicks or impressions. You can usually find that value in any report that shows ad performance over a series of time.
But there’s more to the story.
Did you hire someone to create ad copy? That’s an expense.
Do you have employees who track ad performance and adjust ad spend accordingly? That’s an expense.
Did you hire someone to create a graphic for a banner ad? That’s an expense.
There might even be administrative costs associated with the campaign. Those should be factored in as well.
You see where this is going. You need to consider all operating costs associated with online advertising (and, usually, with a particular ad channel) before you can properly calculate ROAS.
Let’s Look At An Example
John runs a business that sells high-end fashion clothing. He wants to calculate ROAS for an ad campaign that promotes top-notch blue jeans.
For the past 6 months, John has run a Google Ads campaign that cost him $10,000 in clicks. John also has a full-time copywriter on staff who produced the copy for the ad. According to John’s project management software, the amount of time that his copywriter spent on the ad cost the business $1,000.
Also, John has a digital marketing team that tracks ad performance and adjusts ad spend. John’s project management software shows that, for the past 6 months, that team has devoted $4,000 worth of effort to that campaign.
So John’s overall ad spend for the blue jeans campaign during the last 6 months is $10,000 + $1,000 + $4,000 or $15,000.
During that same period of time, John has earned $30,000 from the sale of those upscale blue jeans as a result of that campaign.
So John’s ROAS is $30,000 / $15,000 or 200%.
After looking at that number, John wisely decides to extend the campaign for at least another 3 months. He can make that informed decision because he knows how to calculate ROAS.
How to Calculate ROAS From Advertising
This is where it gets tricky.
In the example above, we greatly abbreviated the process by which John determines his revenue earned. The reality is that it’s quite a bit more complicated than it appears.
Fortunately, though, there are tools to use to help you through this process. The process for calculating the revenue per ad varies from channel to channel. Each one is slightly different.
For example, if you’re using Google Ads, you can set up conversion tracking. Conversion tracking will give you insight into how many people converted once they clicked your ad and what conversion they took part in.
Set Up Conversion Tracking in Google
Setting up your conversion tracking with Google Ads is easy. Once you’re inside your Google Ads dashboard, click on “Summary” and then “Add Conversion Action.” On this screen, type in the website that you want to track. Once your website is entered, you can then enter the Google tag.
To complete the conversion tracking, you will need to add the code to your website. This is something you can do yourself or ask your web developer for help with. If you use a website created with a CMS host, like Squarespace, GoDaddy, WooCommerce, Shopify, Wix, WordPress, or others, your process will look different. If this is the case, be sure to check out Google’s instructions for your selected platform.
Conversion Tracking With Bing Ads
Keep in mind, other advertising mediums such as Bing Ads and Facebook Ads offer solutions for tracking conversions as well.
Using conversion tracking with Bing Ads, takes a few more steps. Start by creating your Microsoft Universal Event Tracking (UET) tag in your Bing Ads dashboard. You can find this option under “Tools” in the upper right-hand corner of your screen.
Using Google Tag Manager, install your Microsoft UET tag. Google does not require the entire UET tag, just the shorter ID code. Once that has been entered, send additional events to Microsoft Ads. Once this is completed, create the conversions you want to track.
In order to get accurate data from your conversion tracking, don’t forget to turn on the cookie consent popup on your website. Once that is activated, configure your Google Tag Manager to interact and accept the user’s consent. Your conversions will only be tracked when the user accepts the tracking cookies.
Conversion Tracking With Facebook Ads
Setting up conversion tracking for Facebook Ads is more straightforward. In your Ads Manager account, follow these steps:
- Select “Campaigns.”
- In the dropdown menu, click “Columns.”
- The “Customize Columns.” This is where you will select the actions or conversions you want to track.
- Once you’ve selected the actions you want, click “Apply.”
That’s it! Your conversion tracking for Facebook Ads is ready to roll.
Conversion Tracking Through a Google Analytics Campaign
If you’re not using conversion tracking on your ad service, you’ll probably have to set up a Google Analytics campaign to track conversions. That involves creating a custom URL that’s derived from your source and campaign.
Once you’ve created the URL, you’ll need to track goals in Google Analytics. When you create goals, you’ll give each goal a value that equates to the amount of revenue earned from the sale.
As you can see, it’s not quite as easy to count beans as you’d like it to be. Unfortunately, once you’ve finally set up the process of tracking conversions, you’re still left with a bit of complexity.
Why? Because there are typically multiple touchpoints in the customer journey to a sale.
For example, Sally is online and she sees John’s ad for fashionable blue jeans. It’s a banner ad on one of her favorite websites.
Sally clicks on the ad and shops on John’s site. She thinks to herself: “I could use a pair of blue jeans and these look great, but I need to wait for payday.”
After payday, Sally is searching for blue jeans online and sees John’s ad. She remembers that she liked the jeans from the banner ad she saw the other day.
Sally clicks on John’s Google Ads ad. She orders a pair of blue jeans from his site.
In that simple example, there were two ads that contributed to the sale. One was a banner ad on a website and the other was a search ad.
Both ads should get credit for the sale. Also, the expense of both ads should be factored into calculating ROAS.
So How Do You Account for Revenue Generated From Multi-Channel Marketing?
There are a few ways.
First, start by setting up multi-channel funnels in Google Analytics. Those reports will give you plenty of metrics so that you’re not playing guessing games.
Then, you have to pick the right attribution model.
What’s an attribution model? It’s a means of giving credit to one or more marketing channels for a sale. You can think of it as a set of rules that govern how to credit sales.
Here are the most popular attribution models:
- Last Click – In this case, you just ignore all other channels except the one that got you the sale. It’s not going to give you a very accurate read of ROAS.
- First Interaction – This is the opposite of Last Click. It’s when you give 100% of the credit for the sale to the first channel that landed the customer on your site.
- Linear – You credit every touchpoint in the funnel equally. For example, if Sally had purchased blue jeans for $100, then $50 of the sale would be attributed to the banner ad and the other $50 to the search ad.
- Position-based – The first and last touchpoints are worth a certain value. Any touch points in between are given equal value.
- Time Decay – Touchpoints closest to the sale, in terms of time, get the most credit. Those farther away get less credit.
- Last Google Ads Click – A great option if you’re using Google Ads. The first (and only) click to the paid search ad on Google gets 100% of the credit for the sale.
- Last Non-Direct Click – All direct traffic is ignored. Instead, all the credit for the sale goes to the last channel the visitor clicked before converting. For example: if a customer opens an email from your business and then visits your website later to make a purchase, the email gets credit for the sale.
So which attribution model is best? That’s a discussion you should have with your business partners and your accountant.
If you’d like some additional assistance in determining the right attribution model, you can use the Google Analytics Model Comparison Tool.
The tool allows you to select up to three attribution models at a time. Then, you can compare the results of each model.
It’s important to test the assumptions you make with each model by experimenting. Increase ad spend (or decrease it) depending on the results you see. Then, evaluate the change and see if the model is giving you the right feedback.
Finally, choose the model that’s giving you the most reliable data.
Calculating ROAS Using a Linear Model
Let’s look at an updated version of John’s situation using the Linear Model.
If 75% of the sales come from the search ad alone and the other 25% come from both the search ad and the display ad (as in Sally’s case) what’s the ROAS?
This is where it gets fun.
Revenue that can be attributed solely to the search ad is $22,500 ($30,000 x 75%).
What about the other $7,500? That gets split evenly between the search ad and the banner ad. So only $3,750 gets attributed to the search ad here.
Therefore, total attributed revenue from the search ad is $22,500 + $3,750 = $26,250.
Now, if we run the ROAS formula again, we get $26,250 / $15,000 or 175%.
That still looks like a pretty good return to John, so he decides to stick with his search ad campaign.
Bottom line: when it comes to ROAS, it’s often not as easy as it should be to determine the “R” or revenue.
How to Track ROAS
Now that you’re an expert at calculating ROAS you’ll want to make sure the data you’re crunching is accurate by making sure you’re properly tracking revenue.
This means that you are accountable for putting the best cost and revenue numbers into your ROAS calculator to glean the best information.
For ecommerce companies, this will be a straightforward process as you can track which clicks led to what pages directly.
The relationship between ad spend and ROAS is very direct and highly correlated for ecommerce companies is the reason ROAS is the preferred metric used by them. For non-ecommerce companies, the relationship between ad spend and ROAS is trickier and begins with conversion tracking, This can be accomplished easily if you’re using an online platform like Google Ads, Facebook, and Twitter.
Call tracking can also be a useful tool to invest in if you’d like a leg up on the competition in the non-ecommerce space.
If you are really focused on making the most out of ROAS calculation then you can track conversions on a CRM (customer relationship management) software.
This method can be rather difficult but is well worth the effort for the meaningful data you will glean from it.
Utilizing a CRM you have the ability to aggregate all your online marketing data to new leads. When the leads are converted into new business you will have the data you need to discern which aspects of your marketing strategy contributed to the conversion.
ROAS FAQs:
1. What’s the breakeven point of the ROAS calculation?
If you run the numbers and get a final value of 100%, (or 1), that’s the breakeven point of your ROAS calculation.
Consider the example just above. If you generated only $15,000 in revenue, then your ROAS would be $15,000 / $15,000 or 100% (or 1).
In other words, you earned exactly as much as you spent.
If you earn less than $15,000, then you’re losing money. If you earn more than $15,000, then you have a positive return.
Keep in mind, that’s breakeven only in terms of ad costs. It doesn’t take into account other business expenses, such as the costs of goods sold, fixed costs, or general selling costs.
2. Do marketers use a ROAS calculation with offline advertising?
It’s difficult to determine how to calculate ROAS with offline ads.
Remember, one of the biggest advantages of online advertising is that you can tell which ads are getting clicks and bringing in customers. With offline ads, that’s harder to do.
Think about it: if a few people visit your store because they saw a billboard ad, how do you know that’s why they showed up there? And even if they volunteer that info, do you keep track of every customer to find out how they heard about your store?
It’s not easy.
ROAS is a metric best left to digital advertising.
3. What’s the difference between ROAS and ACOS?
ACOS stands for “Ad Cost of Sales.” It’s basically a different way of looking at ROAS.
For example, if you generate $200 in sales with $20 in ad spend, then your ROAS is 200 / 20 or 10.
Another way to look at that is by answering the question: “What percentage of my revenue is my advertising cost?” The answer to that question is the ACOS.
In this case, the ACOS is 20 / 200 or 10%.
4. What is a good ROAS for Google Ads?
Finding your desirable ROAS will vary from business to business.
However, a good rule of thumb is: If your ROAS is below 3:1 take a deeper look at your marketing because you may be losing money.
If you’re at a 4:1 ROAS, your marketing is likely turning profits.
A ROAS of 5:1 and higher means your marketing has paid off and your numbers should look pretty good!
5. How can you optimize ROAS?
In order to optimize your ROAS, you can increase your revenue generated while keeping your costs stable, lower the cost of ads while maintaining the revenue, or increase revenue while lowering the cost.
Other ways of optimizing your ROAS are to:
- Optimize your site for mobile.
- Learn from what your competitors are doing well.
- Refine your keyword targeting and analysis
- Use geo-targeting in your ads
- Optimize your landing pages
- Use conversion rate optimization (CRO) tactics
- Promote seasonal offers and coupons
- Utilize product listing ads (PLAs)
6. What is the formula for ROAS?
The formula to calculate ROAS is to divide the revenue that is earned through advertising by the amount of money that is spent on advertising to find ROAS.
7. How important is ROAS?
ROAS is very important to ensure you stay within your selected advertising budget. Determining your ROAS will help you decide if a particular ad campaign is working.
8. Are there agencies that I can hire to help me boost my ROAS?
While ROAS will vary depending on your industry, there are agencies that specialize in digital marketing and can prepare a strategy for you that will increase your ROAS and your profit margin.
9. When it comes to calculating ROAS, how important is it to Set Up Conversion Tracking
Properly setting up conversion tracking is very important to determine an accurate ROAS. Without accurate data, you’ll never be able to calculate a true number.
10. Do all platforms use the same process for setting up conversion tracking?
No. The process of setting up conversion tracking is different for each platform, whether you’re using Google Ads, Bing Ads, or Facebook Ads. Just like any other part of the advertising process, each platform has its own process. Facebook Ads is the most user-friendly but Google Ads and Bing Ads are not overly difficult.
Wrapping Up
Now you know how to calculate ROAS.
However, it’s not always easy. You’ll have to enlist the aid of your favorite analytics tools to determine if your advertising dollars are bearing fruit.
Armed with that info, you can make the necessary adjustments to your online strategy.